
Concept explainers
Videos
The following pictograph shows the six occupations with the largest estimated numerical increase in employment in the United States between 2016 and 2026. Use this graph to answer Exercises 1 through 4.
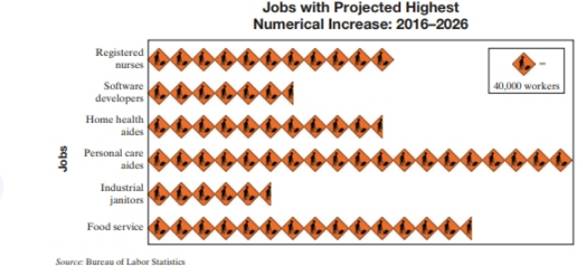
- Approximate the increase in the number of softwar develpers from 2016 to 2026.
The approximate increase in the number of software developers from 2016 to 2026
Answer to Problem 1IR
Explanation of Solution
Given information:
Pictograph showing the six occupations with the largest estimated numerical increase in employment in the United States between 2016 and 2026

Concept Used:
Pictograph is a graph in which pictures are used they contains a key that explains the meaning of the symbol used. It’s advantage is that comparisons can easily be made.
Calculation:
In order determine the approximate increase in the number of software developers from 2016 to 2026, we have to read the given pictograph and find the number of symbols software developers correspond to.
As, the given pictograph shows that the software developers corresponds to
Thus, the approximate increase in the number of software developers from 2016 to 2026 is
Thus, there is increment of approximate
Want to see more full solutions like this?
Chapter 7 Solutions
EP ALGEBRA FOUND.:PREALG.-MYLABMATH ACC


- Solve questions by Course Name (Ordinary Differential Equations II 2)arrow_forwardplease Solve questions by Course Name( Ordinary Differential Equations II 2)arrow_forwardInThe Northern Lights are bright flashes of colored light between 50 and 200 miles above Earth. Suppose a flash occurs 150 miles above Earth. What is the measure of arc BD, the portion of Earth from which the flash is visible? (Earth’s radius is approximately 4000 miles.)arrow_forward
- e). n! (n - 1)!arrow_forwardSuppose you flip a fair two-sided coin four times and record the result. a). List the sample space of this experiment. That is, list all possible outcomes that could occur when flipping a fair two-sided coin four total times. Assume the two sides of the coin are Heads (H) and Tails (T).arrow_forwarde). n! (n - 1)!arrow_forward
- Evaluate the following expression and show your work to support your calculations. a). 6! b). 4! 3!0! 7! c). 5!2! d). 5!2! e). n! (n - 1)!arrow_forwardAmy and Samiha have a hat that contains two playing cards, one ace and one king. They are playing a game where they randomly pick a card out of the hat four times, with replacement. Amy thinks that the probability of getting exactly two aces in four picks is equal to the probability of not getting exactly two aces in four picks. Samiha disagrees. She thinks that the probability of not getting exactly two aces is greater. The sample space of possible outcomes is listed below. A represents an ace, and K represents a king. Who is correct?arrow_forwardConsider the exponential function f(x) = 12x. Complete the sentences about the key features of the graph. The domain is all real numbers. The range is y> 0. The equation of the asymptote is y = 0 The y-intercept is 1arrow_forward
 Glencoe Algebra 1, Student Edition, 9780079039897...AlgebraISBN:9780079039897Author:CarterPublisher:McGraw Hill
 Algebra: Structure And Method, Book 1AlgebraISBN:9780395977224Author:Richard G. Brown, Mary P. Dolciani, Robert H. Sorgenfrey, William L. ColePublisher:McDougal Littell
 Intermediate AlgebraAlgebraISBN:9781285195728Author:Jerome E. Kaufmann, Karen L. SchwittersPublisher:Cengage Learning
 Algebra for College StudentsAlgebraISBN:9781285195780Author:Jerome E. Kaufmann, Karen L. SchwittersPublisher:Cengage Learning