Concept explainers
Videos
What is a bar chart? A pie chart? A histogram? A box plot?
The meaning of a bar chart, a pie chart, a histogram and a box plot.
Explanation of Solution
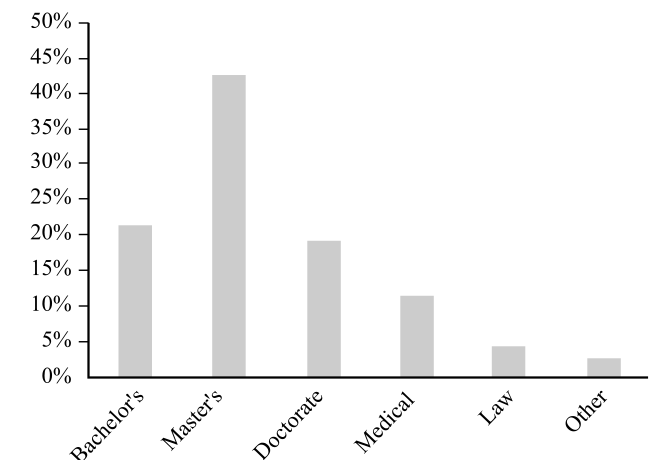
Bar chart:
Bar chart is a pictorial display of provided data by rectangular bars. Bar charts can be shown vertically or horizontally.
For example, the percentage of student to give highest degree planned to pursue, is provided in a table.
| Highest degree planned | Percentage |
| Bachelor’s | 21.1 |
| Master’s | 42.1 |
| Doctorate | 19.0 |
| Medical | 11.2 |
| Law | 4.2 |
| Others | 2.4 |
| Total | 100.0 |
The representation of the data in a bar chart is provided below.
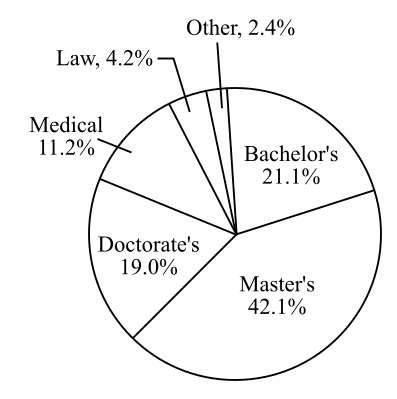
Pie chart:
Pie chart consists of a circle subdivided into sectors in which each sector corresponds to a category. The area of each sector is proportional to the percentage of items in that category.
For example, the data is shown in a tabular form.
| Highest degree planned | Percentage | |
| Bachelor’s | 21.1 | |
| Master’s | 42.1 | |
| Doctorate | 19.0 | |
| Medical | 11.2 | |
| Law | 4.2 | |
| Others | 2.4 |
The representation of data in a pie chart is provided below.
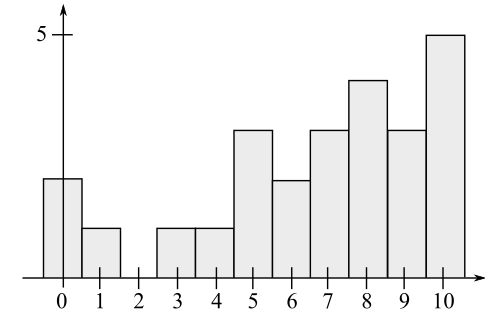
Histograms:
A histogram represents a graphical or visual interpretation of data. It is similar to the bar graph except, it has no gaps between the bars. The data are represented between x-axis and y-axis. The x-axis represents a scale of values and y-axis represents a value which corresponds to a value of
For example- the quiz score of 25 students of a class are,
The quiz score data of students are shown in a tabular form.
| Scores | 0 | 1 | 2 | 3 | 4 | 5 | 6 | 7 | 8 | 9 | 10 |
| Number of student | 2 | 1 | 0 | 1 | 1 | 3 | 2 | 3 | 4 | 3 | 5 |
The representation of the quiz score data in a histogram is provided below.
Box plot:
A box plot shows a graphical representation of collection of data through quartiles. Quartiles are the medians of the sets of data to the left and right to the median.
The median of the numbers less than the median is called the first Quartile
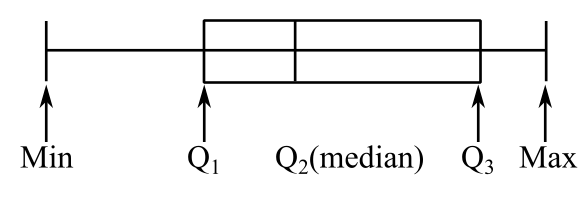
Here, the
Want to see more full solutions like this?
Chapter 7 Solutions
FINITE MATHEMATICS & ITS APPLICATIONS
Additional Math Textbook Solutions
College Algebra (Collegiate Math)
Finite Mathematics for Business, Economics, Life Sciences and Social Sciences
A First Course in Probability (10th Edition)
Precalculus: A Unit Circle Approach (3rd Edition)
Precalculus
Intermediate Algebra (13th Edition)


- 8.1.12 Ishikawa et al. [“Evaluation of Adhesiveness of Acinetobacter sp. Tol 5 to Abiotic Surfaces,” Journal of Bioscience and Bioengineering (Vol. 113(6), pp. 719–725)] studied the adhesion of various biofilms to solid surfaces for possible use in environmental technologies. Adhesion assay is conducted by measuring absorbance at A590. Suppose that for the bacterial strain Acinetobacter, five measurements gave readings of 2.69, 5.76, 2.67, 1.62, and 4.12 dyne-cm2. Assume that the standard deviation is known to be 0.66 dyne-cm2. a. Find a 95% confidence interval for the mean adhesion. b. If the scientists want the confidence interval to be no wider than 0.55 dyne-cm2, how many observations should they take?arrow_forwardAnswer questions 8.2.1 and 8.2.2 respectivelyarrow_forward8.2.3 A research engineer for a tire manufacturer is investigating tire life for a new rubber compound and has built 16 tires and tested them to end-of-life in a road test. The sample mean and standard deviation are 60,139.7 and 3645.94 kilometers. Find a 95% confidence interval on mean tire life. 8.2.4 Determine the t-percentile that is required to construct each of the following one-sided confidence intervals: a. Confidence level = 95%, degrees of freedom = 14 b. Confidence level = 99%, degrees of freedom = 19 c. Confidence level = 99.9%, degrees of freedom = 24arrow_forward
- 8.1.6The yield of a chemical process is being studied. From previous experience, yield is known to be normally distributed and σ = 3. The past 5 days of plant operation have resulted in the following percent yields: 91.6, 88.75, 90.8, 89.95, and 91.3. Find a 95% two-sided confidence interval on the true mean yield. 8.1.7 .A manufacturer produces piston rings for an automobile engine. It is known that ring diameter is normally distributed with σ = 0.001 millimeters. A random sample of 15 rings has a mean diameter of x = 74.036 millimeters. a. Construct a 99% two-sided confidence interval on the mean piston ring diameter. b. Construct a 99% lower-confidence bound on the mean piston ring diameter. Compare the lower bound of this confi- dence interval with the one in part (a).arrow_forward8.1.2 .Consider the one-sided confidence interval expressions for a mean of a normal population. a. What value of zα would result in a 90% CI? b. What value of zα would result in a 95% CI? c. What value of zα would result in a 99% CI? 8.1.3 A random sample has been taken from a normal distribution and the following confidence intervals constructed using the same data: (38.02, 61.98) and (39.95, 60.05) a. What is the value of the sample mean? b. One of these intervals is a 95% CI and the other is a 90% CI. Which one is the 95% CI and why?arrow_forward8.1.4 . A confidence interval estimate is desired for the gain in a circuit on a semiconductor device. Assume that gain is normally distributed with standard deviation σ = 20. a. How large must n be if the length of the 95% CI is to be 40? b. How large must n be if the length of the 99% CI is to be 40? 8.1.5 Suppose that n = 100 random samples of water from a freshwater lake were taken and the calcium concentration (milligrams per liter) measured. A 95% CI on the mean calcium concentration is 0.49 g μ g 0.82. a. Would a 99% CI calculated from the same sample data be longer or shorter? b. Consider the following statement: There is a 95% chance that μ is between 0.49 and 0.82. Is this statement correct? Explain your answer. c. Consider the following statement: If n = 100 random samples of water from the lake were taken and the 95% CI on μ computed, and this process were repeated 1000 times, 950 of the CIs would contain the true value of μ. Is this statement correct? Explain your answerarrow_forward
- 2 6. Modelling. Suppose that we have two tanks (A and B) between which a mixture of brine flows. Tank A contains 200 liters of water in which 50 kilograms of salt has been dissolved and Tank B contains 100 liters of pure water. Water containing 1kg of salt per liter is pumped into Tank A at the rate of 5 liters per minute. Brine mixture is pumped into Tank A from Tank B at the rate of 3 liters per minute and brine mixture is pumped from Tank A into Tank B at the rate of 8 liters per minute. Brine is drained from Tank B at a rate of 5 liters per minute. (a) Draw and carefully label a picture of the situation, including both tanks and the flow of brine between them. JankA 1ks of Salt Slits Pump EL Brine mit tark A from tank 13 Tank 13 k 3L zooliters of Ico liters of water with pure water. Saky salt → 777 disslore inside Brine mix is pumped from tank A to B of 82 Brine drainen min by Gf salt (b) Assume all brine mixtures are well-stirred. If we let t be the time in minutes, let x(t) 1ks…arrow_forward5. The graph of ƒ is given below. Sketch a graph of f'. 6. The graph of ƒ is given below. Sketch a graph of f'. 0 x 7. The graph of ƒ is given below. List the x-values where f is not differentiable. 0 A 2 4arrow_forward2. DRAW a picture, label using variables to represent each component, set up an equation to relate the variables, then differentiate the equation to solve the problem below. The top of a ladder slides down a vertical wall at a rate of 0.15 m/s. At the moment when the bottom of the ladder is 3 m from the wall, it slides away from the wall at a rate of 0.2 m/s. How long is the ladder?arrow_forward
- Please answer all questions and show full credit pleasearrow_forwardplease solve with full steps pleasearrow_forward4. Identify at least two mistakes in Francisco's work. Correct the mistakes and complete the problem by using the second derivative test. 2f 2X 2. Find the relative maximum and relative minimum points of f(x) = 2x3 + 3x² - 3, using the First Derivative Test or the Second Derivative Test. bx+ bx 6x +6x=0 12x- af 24 = 0 x=0 108 -2 5. Identify at least three mistakes in Francisco's work. Then sketch the graph of the function and label the local max and local min. 1. Find the equation of the tangent line to the curve y=x-2x3+x-2 at the point (1.-2). Sketch the araph of y=x42x3+x-2 and the tangent line at (1,-2) y' = 4x-6x y' (1) = 4(1) - 667 - 2 = 4(-2)4127-6(-2) 5-8-19-20 =arrow_forward
 Big Ideas Math A Bridge To Success Algebra 1: Stu...AlgebraISBN:9781680331141Author:HOUGHTON MIFFLIN HARCOURTPublisher:Houghton Mifflin Harcourt
 Holt Mcdougal Larson Pre-algebra: Student Edition...AlgebraISBN:9780547587776Author:HOLT MCDOUGALPublisher:HOLT MCDOUGAL
 Glencoe Algebra 1, Student Edition, 9780079039897...AlgebraISBN:9780079039897Author:CarterPublisher:McGraw Hill