
a)
To evaluate the value of total product and marginal product and average product of labor of the Dmining company in the given table.
a)
Explanation of Solution
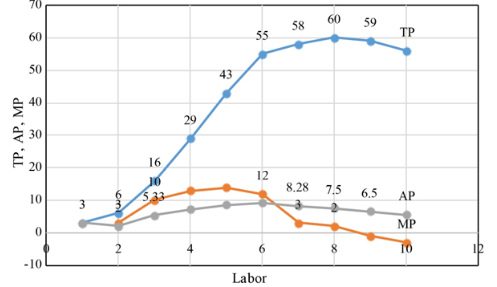
| Labor input L | Total product TP | Marginal product MP | Average product AP |
| 1 | 3 | - | 3 |
| 2 | 6 | 3 | 2 |
| 3 | 16 | 10 | 5.33 |
| 4 | 29 | 13 | 7.25 |
| 5 | 43 | 14 | 8.6 |
| 6 | 55 | 12 | 9.16 |
| 7 | 58 | 3 | 8.28 |
| 8 | 60 | 2 | 7.5 |
| 9 | 59 | -1 | 6.5 |
| 10 | 56 | -3 | 5.6 |
From the given data Average Product, Total Product, and marginal product has been calculated. Capital is set at 500. The total product is production, the marginal product contributes to the overall output, and the average labor product is the overall labor dividedproduct. Thus from 1-6 shows increasing rate, decreasing rate from 6-8 and negative rate of production from 9-10.
Introduction: Production functions play a significant role in determining the price of the output. It helps the producer to calculate how much inputs are needed to generate a particular amount of output. So, the producer can make decision based on cost minimization.
b)
To ascertain the total product, marginal product and average product functions.
b)
Explanation of Solution
Introduction: Development is aimed at producing goods and services that satisfy people's needs as per their
c)
To evaluate the boundaries of the three stages of production.
c)
Explanation of Solution
Stage 1 from point 0-5 shows increasing rate in total production of output, stage 2 from point 5-9 shows decreasing rate in total production and in the stage 3 from point 9-11 shows negative rate in total production of output.
Introduction: Economists accept three distinct stages of development identified by a principle known as the law of rising marginal returns. This law states that if you add more workers to the manufacturing process, the output will increase but the scale of that increase will be smaller for each worker.
Want to see more full solutions like this?
Chapter 7 Solutions
Bundle: Managerial Economics: Applications, Strategies And Tactics, 14th + Mindtap Economics, 1 Term (6 Months) Printed Access Card

- Styrofoam is non-biodegradable and is not easily recyclable. Many cities and at least one state have enacted laws that ban the use of polystyrene containers. These locales understand that banning these containers will force many businesses to turn to other more expensive forms of packaging and cups, but argue the ban is environmentally important. Shane owns a firm with a conventional production function resulting in U-shaped ATC, AVC, and MC curves. Shane's business sells takeout food and drinks that are currently packaged in styrofoam containers and cups. Graph the short-run AFC0, AVC0, ATC0, and MC0 curves for Shane's firm before the ban on using styrofoam containers.arrow_forwardd-farrow_forwarda-c pleasearrow_forward
- d-farrow_forwardPART II: Multipart Problems wood or solem of triflussd aidi 1. Assume that a society has a polluting industry comprising two firms, where the industry-level marginal abatement cost curve is given by: MAC = 24 - ()E and the marginal damage function is given by: MDF = 2E. What is the efficient level of emissions? b. What constant per-unit emissions tax could achieve the efficient emissions level? points) c. What is the net benefit to society of moving from the unregulated emissions level to the efficient level? In response to industry complaints about the costs of the tax, a cap-and-trade program is proposed. The marginal abatement cost curves for the two firms are given by: MAC=24-E and MAC2 = 24-2E2. d. How could a cap-and-trade program that achieves the same level of emissions as the tax be designed to reduce the costs of regulation to the two firms?arrow_forwardOnly #4 please, Use a graph please if needed to help provearrow_forward
- a-carrow_forwardFor these questions, you must state "true," "false," or "uncertain" and argue your case (roughly 3 to 5 sentences). When appropriate, the use of graphs will make for stronger answers. Credit will depend entirely on the quality of your explanation. 1. If the industry facing regulation for its pollutant emissions has a lot of political capital, direct regulatory intervention will be more viable than an emissions tax to address this market failure. 2. A stated-preference method will provide a measure of the value of Komodo dragons that is more accurate than the value estimated through application of the travel cost model to visitation data for Komodo National Park in Indonesia. 3. A correlation between community demographics and the present location of polluting facilities is sufficient to claim a violation of distributive justice. olsvrc Q 4. When the damages from pollution are uncertain, a price-based mechanism is best equipped to manage the costs of the regulator's imperfect…arrow_forwardFor environmental economics, question number 2 only please-- thank you!arrow_forward
- For these questions, you must state "true," "false," or "uncertain" and argue your case (roughly 3 to 5 sentences). When appropriate, the use of graphs will make for stronger answers. Credit will depend entirely on the quality of your explanation. 1. If the industry facing regulation for its pollutant emissions has a lot of political capital, direct regulatory intervention will be more viable than an emissions tax to address this market failure. cullog iba linevoz ve bubivorearrow_forwardExercise 3 The production function of a firm is described by the following equation Q=10,000-3L2 where L stands for the units of labour. a) Draw a graph for this equation. Use the quantity produced in the y-axis, and the units of labour in the x-axis. b) What is the maximum production level? c) How many units of labour are needed at that point? d) Provide one reference with you answer.arrow_forwardExercise 1 Consider the market supply curve which passes through the intercept and from which the market equilibrium data is known, this is, the price and quantity of equilibrium PE=50 and QE=2000. Considering those two points, find the equation of the supply. Draw a graph of this line. Provide one reference with your answer. Exercise 2 Considering the previous supply line, determine if the following demand function corresponds to the market demand equilibrium stated above. QD=3000-2p.arrow_forward


 Managerial Economics: Applications, Strategies an...EconomicsISBN:9781305506381Author:James R. McGuigan, R. Charles Moyer, Frederick H.deB. HarrisPublisher:Cengage Learning
 Managerial Economics: A Problem Solving ApproachEconomicsISBN:9781337106665Author:Luke M. Froeb, Brian T. McCann, Michael R. Ward, Mike ShorPublisher:Cengage Learning