
a.
Obtain the sample
Find the coefficient of variation for the lengths and widths.
a.
Answer to Problem 1DH
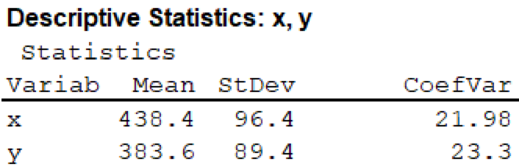
The sample mean and sample standard deviation for the lengths and widths are given below:
| Variable | Mean | Standard deviation | Coefficient of variation |
| Length | 438.4 | 96.4 | 21.98 |
| Width | 383.6 | 89.4 | 23.3 |
Explanation of Solution
Calculation:
Let x represent the lengths of little neck clams and y represent the widths of little neck clams.
To find sample mean, sample standard deviation, and the coefficient of variation for x, y using MINITAB.
Step-by-step procedure to obtain the descriptive measures using MINITAB:
- Enter the data in MINITAB Software.
- Select Stat > Basic statistics > Display
Descriptive Statistics - Select x and y in variable.
- In ‘statistics’ choose Mean, Standard deviation, Coefficient of variation.
Output obtained using MINITAB is given below:
(b)
Obtain the 95% confidence interval for the population mean length of all Garrison Bay little neck clams.
(b)
Answer to Problem 1DH
The 95% confidence interval for the population mean length of all Garrison Bay little neck clams is between 406.5 and 470.3.
Explanation of Solution
Calculation:
Let x represent the lengths of little neck clams,
Here, one has to find 95% confidence interval for μ.
The confidence level, c=0.95.
Using?Table?5: Areas of a Standard
From Part (a), the value of a sample standard deviation,
The margin of error is as follows:
The 95% confidence interval is obtained as shown below:
The 95% confidence interval for μ is (406.5, 470.3).
(c)
Obtain the number of more little neck clams that would be needed in a sample.
(c)
Answer to Problem 1DH
The additional little neck clams needed is 357.
Explanation of Solution
Calculation:
In this scenario, it is known that
One has to find the sample size n.
The confidence level, c=0.95.
Using?Table?5: Areas of a Standard Normal Distribution?of?Appendix II, the critical value of 95% confidence level is
The number of more little neck clams that would be needed in a sample is obtained as follows:
The sample size needed to be 95% sure that the sample mean is within a maximal margin of error of 10 mm of the population mean length is 357.
Thus, the additional little neck clams needed is
d.
Obtain the 95% confidence interval for the population mean width of all Garrison Bay little neck clams.
d.
Answer to Problem 1DH
The 95% confidence interval for the population mean width of all Garrison Bay little neck clams is between 354.03 and 413.23.
Explanation of Solution
Calculation:
Let y represent the width of little neck clams,
Here, one has to find 95% confidence interval for μ.
The confidence level, c=0.95.
Using?Table?5: Areas of a Standard Normal Distribution?of?Appendix II, the critical value of 95% confidence level is,
The 95% confidence interval is obtained as follows:
The 95% confidence interval for μ is (354.03, 413.23).
(e)
Find the number of more little neck clams that would be needed in a sample.
(e)
Answer to Problem 1DH
The additional little neck clams needed is 272.
Explanation of Solution
Calculation:
Here, it is known that
The number of more little neck clams that would be needed in a sample is obtained as follows:
The sample size needed to be 95% sure that the sample mean is within a maximal margin of error of 10 mm of the population mean length is 307.
Thus, the additional little neck clams needed is
f)
State whether the sample measurements length and width are independent or dependent.
f)
Answer to Problem 1DH
The sample measurements length and width are dependent.
Explanation of Solution
The same 35 clams were used for measuring length and width. The sample measurements of length and width are dependent since the 95% confidence interval for length increases at the same level of confidence, and the width is decreased.
Want to see more full solutions like this?
Chapter 7 Solutions
Bundle: Understandable Statistics: Concepts And Methods, 12th + Jmp Printed Access Card For Peck's Statistics + Webassign Printed Access Card For ... And Methods, 12th Edition, Single-term

- Binomial Prob. Question: A new teaching method claims to improve student engagement. A survey reveals that 60% of students find this method engaging. If 15 students are randomly selected, what is the probability that: a) Exactly 9 students find the method engaging?b) At least 7 students find the method engaging? (2 points = 1 x 2 answers) Provide answers in the yellow cellsarrow_forwardIn a survey of 2273 adults, 739 say they believe in UFOS. Construct a 95% confidence interval for the population proportion of adults who believe in UFOs. A 95% confidence interval for the population proportion is ( ☐, ☐ ). (Round to three decimal places as needed.)arrow_forwardFind the minimum sample size n needed to estimate μ for the given values of c, σ, and E. C=0.98, σ 6.7, and E = 2 Assume that a preliminary sample has at least 30 members. n = (Round up to the nearest whole number.)arrow_forward
- In a survey of 2193 adults in a recent year, 1233 say they have made a New Year's resolution. Construct 90% and 95% confidence intervals for the population proportion. Interpret the results and compare the widths of the confidence intervals. The 90% confidence interval for the population proportion p is (Round to three decimal places as needed.) J.D) .arrow_forwardLet p be the population proportion for the following condition. Find the point estimates for p and q. In a survey of 1143 adults from country A, 317 said that they were not confident that the food they eat in country A is safe. The point estimate for p, p, is (Round to three decimal places as needed.) ...arrow_forward(c) Because logistic regression predicts probabilities of outcomes, observations used to build a logistic regression model need not be independent. A. false: all observations must be independent B. true C. false: only observations with the same outcome need to be independent I ANSWERED: A. false: all observations must be independent. (This was marked wrong but I have no idea why. Isn't this a basic assumption of logistic regression)arrow_forward
- Business discussarrow_forwardSpam filters are built on principles similar to those used in logistic regression. We fit a probability that each message is spam or not spam. We have several variables for each email. Here are a few: to_multiple=1 if there are multiple recipients, winner=1 if the word 'winner' appears in the subject line, format=1 if the email is poorly formatted, re_subj=1 if "re" appears in the subject line. A logistic model was fit to a dataset with the following output: Estimate SE Z Pr(>|Z|) (Intercept) -0.8161 0.086 -9.4895 0 to_multiple -2.5651 0.3052 -8.4047 0 winner 1.5801 0.3156 5.0067 0 format -0.1528 0.1136 -1.3451 0.1786 re_subj -2.8401 0.363 -7.824 0 (a) Write down the model using the coefficients from the model fit.log_odds(spam) = -0.8161 + -2.5651 + to_multiple + 1.5801 winner + -0.1528 format + -2.8401 re_subj(b) Suppose we have an observation where to_multiple=0, winner=1, format=0, and re_subj=0. What is the predicted probability that this message is spam?…arrow_forwardConsider an event X comprised of three outcomes whose probabilities are 9/18, 1/18,and 6/18. Compute the probability of the complement of the event. Question content area bottom Part 1 A.1/2 B.2/18 C.16/18 D.16/3arrow_forward
- John and Mike were offered mints. What is the probability that at least John or Mike would respond favorably? (Hint: Use the classical definition.) Question content area bottom Part 1 A.1/2 B.3/4 C.1/8 D.3/8arrow_forwardThe details of the clock sales at a supermarket for the past 6 weeks are shown in the table below. The time series appears to be relatively stable, without trend, seasonal, or cyclical effects. The simple moving average value of k is set at 2. What is the simple moving average root mean square error? Round to two decimal places. Week Units sold 1 88 2 44 3 54 4 65 5 72 6 85 Question content area bottom Part 1 A. 207.13 B. 20.12 C. 14.39 D. 0.21arrow_forwardThe details of the clock sales at a supermarket for the past 6 weeks are shown in the table below. The time series appears to be relatively stable, without trend, seasonal, or cyclical effects. The simple moving average value of k is set at 2. If the smoothing constant is assumed to be 0.7, and setting F1 and F2=A1, what is the exponential smoothing sales forecast for week 7? Round to the nearest whole number. Week Units sold 1 88 2 44 3 54 4 65 5 72 6 85 Question content area bottom Part 1 A. 80 clocks B. 60 clocks C. 70 clocks D. 50 clocksarrow_forward
 Holt Mcdougal Larson Pre-algebra: Student Edition...AlgebraISBN:9780547587776Author:HOLT MCDOUGALPublisher:HOLT MCDOUGAL
 Glencoe Algebra 1, Student Edition, 9780079039897...AlgebraISBN:9780079039897Author:CarterPublisher:McGraw Hill
 Big Ideas Math A Bridge To Success Algebra 1: Stu...AlgebraISBN:9781680331141Author:HOUGHTON MIFFLIN HARCOURTPublisher:Houghton Mifflin Harcourt