
MyLab Math with Pearson eText -- Access Card -- for Using & Understanding Mathematics with Integrated Review
7th Edition
ISBN: 9780134715865
Author: Jeffrey O. Bennett, William L. Briggs
Publisher: PEARSON
expand_more
expand_more
format_list_bulleted
Concept explainers
Videos
Question
Chapter 6.C, Problem 52E
(a)
To determine
Explain chosen data set have a normal or nearly
(b)
To determine
To calculate:
To get a conclusion about drinking alcohol amount with regardto different ages clearly.
Given:
Data of Alcohol usage in adults.
Graph:
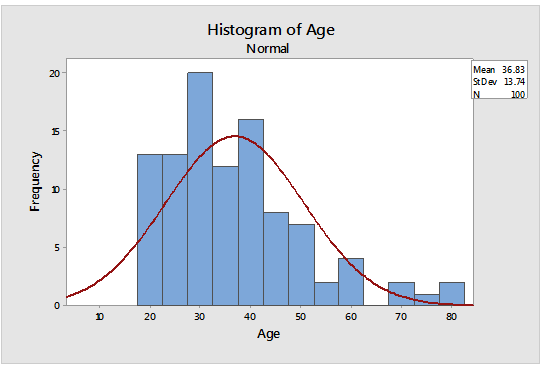
(c)
To determine
To determine whether this distribution is normal or not normal as expected.
Expert Solution & Answer
Want to see the full answer?
Check out a sample textbook solution
Students have asked these similar questions
answer number 4
3. Bayesian Inference – Updating Beliefs
A medical test for a rare disease has the following characteristics:
Sensitivity (true positive rate): 99%
Specificity (true negative rate): 98%
The disease occurs in 0.5% of the population.
A patient receives a positive test result.
Questions:
a) Define the relevant events and use Bayes’ Theorem to compute the probability that the patient actually has the disease.b) Explain why the result might seem counterintuitive, despite the high sensitivity and specificity.c) Discuss how prior probabilities influence posterior beliefs in Bayesian inference.d) Suppose a second, independent test with the same accuracy is conducted and is also positive. Update the probability that the patient has the disease.
answer number 6
Chapter 6 Solutions
MyLab Math with Pearson eText -- Access Card -- for Using & Understanding Mathematics with Integrated Review
Ch. 6.A - Prob. 1QQCh. 6.A - On an astronomy exam, 20 students score below 79...Ch. 6.A - One hundred students take a chemistry exam. All...Ch. 6.A - Twenty students take a political science exam....Ch. 6.A - A survey asks students to state many sodas they...Ch. 6.A - Among professional actors, a small number of...Ch. 6.A - The distribution of wages at a company is...Ch. 6.A - Compared to a distribution with a broad central...Ch. 6.A - If you compared the distribution of weights of 20...Ch. 6.A - The mayor of a town is considering a run for...
Ch. 6.A - 1. Define and distinguish among mean, median, and...Ch. 6.A - Prob. 2ECh. 6.A - Briefly describe at least two possible sources of...Ch. 6.A - Prob. 4ECh. 6.A - Prob. 5ECh. 6.A - Prob. 6ECh. 6.A - In my data set of 10 exam scores, the mean turned...Ch. 6.A - In my data set of 10 exam scores, the median...Ch. 6.A - I made a distribution of 15 apartment rents in my...Ch. 6.A - Two extremely tall people skewed the distribution...Ch. 6.A - The distribution of grades was left-skewed, but...Ch. 6.A - There’s much more variation in the ages of the...Ch. 6.A - 13-18: Mean, Median, and Mode. Compute the mean,...Ch. 6.A - Mean, Median, and Mode. Compute the mean, median,...Ch. 6.A - Mean, Median, and Mode. Compute the mean, median,...Ch. 6.A - Mean, Median, and Mode. Compute the mean, median,...Ch. 6.A - 13–18: Mean, Median, and Mode. Compute the mean,...Ch. 6.A - 13-18: Mean, Median, and Mode. Compute the mean,...Ch. 6.A - Outlier Coke. Cans of Coca-Cola vary slightly in...Ch. 6.A - 20. Margin of Victory. The following data give the...Ch. 6.A - Appropriate Average. For each of the following...Ch. 6.A - 21-26: Appropriate Average. For each of the...Ch. 6.A - 21-26: Appropriate Average. For each of the...Ch. 6.A - 21-26: Appropriate Average. For each of the...Ch. 6.A - 21-26: Appropriate Average. For each of the...Ch. 6.A - 21-26: Appropriate Average. For each of the...Ch. 6.A - 27-34: Describing Distributions Consider the...Ch. 6.A - Describing Distributions. Consider the following...Ch. 6.A - 27-34: Describing Distributions Consider the...Ch. 6.A - Describing Distributions. Consider the following...Ch. 6.A - 27-34: Describing Distributions Consider the...Ch. 6.A - Describing Distributions. Consider the following...Ch. 6.A - Prob. 33ECh. 6.A - Describing Distributions. Consider the following...Ch. 6.A - Prob. 35ECh. 6.A - 35-36: Understanding Distributions. For the given...Ch. 6.A - Smooth Distributions. Through each histogram, draw...Ch. 6.A - Smooth Distributions. For each histogram, draw a...Ch. 6.A - Smooth Distributions. For each histogram, draw a...Ch. 6.A - Prob. 40ECh. 6.A - Family Income. Suppose you study family income in...Ch. 6.A - Airline Delays. Suppose you are a scheduler for a...Ch. 6.A - Weighted Means. We often deal with weighted means,...Ch. 6.A - Weighted Means. We often deal with weighted means,...Ch. 6.A - Prob. 45ECh. 6.A - Prob. 46ECh. 6.A - Prob. 47ECh. 6.A - Prob. 48ECh. 6.A - 50. Daily Averages. Cite three examples of...Ch. 6.A - 51. Distributions in the News. Find three recent...Ch. 6.A - Answer the following questions using procedures...Ch. 6.A - Prob. 52ECh. 6.A - 53. StatCrunch Project. Choose a data set...Ch. 6.B - The lowest score on an exam was 62, the median...Ch. 6.B - Which of the following is not part of a...Ch. 6.B - The lower quartile for hourly wages at a coffee...Ch. 6.B - Is it possible for a distribution to have a mean...Ch. 6.B - Suppose you are given the mean and just one data...Ch. 6.B - The standard deviation is best described as a...Ch. 6.B - What type of data distribution has a negative...Ch. 6.B - In any distribution, it is always true that a. the...Ch. 6.B - Which data set would you expect to have the...Ch. 6.B - Professors Smith, Jones, and Garcia all got the...Ch. 6.B - Consider two grocery stores at which the mean time...Ch. 6.B - Describe how we define and calculate the range of...Ch. 6.B - Prob. 3ECh. 6.B - Prob. 4ECh. 6.B - Prob. 5ECh. 6.B - Prob. 6ECh. 6.B - The distributions of scores on two exams had the...Ch. 6.B - The highest exam score was in the upper quartile...Ch. 6.B - For the 30 students who took the test, the high...Ch. 6.B - I examined the data carefully, and the range was...Ch. 6.B - The standard deviation for the heights of a group...Ch. 6.B - The mean gas mileage of the compact cars we tested...Ch. 6.B - 13. Big Bank Verification. Find the mean and...Ch. 6.B - Prob. 14ECh. 6.B - Comparing Variations. Consider the following data...Ch. 6.B - Prob. 16ECh. 6.B - Prob. 17ECh. 6.B - Comparing Variations. Consider the following data...Ch. 6.B - Understanding Variation. The following exercises...Ch. 6.B - Understanding Variation. The following exercises...Ch. 6.B - Pizza Deliveries. After recording the pizza...Ch. 6.B - Airline Arrival Times. Two airlines have data on...Ch. 6.B - 23. Portfolio Standard Deviation. The book...Ch. 6.B - Defect Rates. Two factories each produce 1000...Ch. 6.B - 25. Ice Cream Deviations. Each night you total the...Ch. 6.B - Vet Data. A small animal veterinarian reviews her...Ch. 6.B - Prob. 27ECh. 6.B - Prob. 28ECh. 6.B - 29. Quality Control. An auto transmission...Ch. 6.B - Web Data Sets. Go to any website that gives data...Ch. 6.B - Prob. 31ECh. 6.B - Prob. 32ECh. 6.B - Prob. 33ECh. 6.B - Prob. 34ECh. 6.B - 35. Variation in StatCrunch. Load the data set...Ch. 6.B - 36. StatCrunch Project. Choose a data set...Ch. 6.C - Graphs of normal distributions a. always look...Ch. 6.C - In a normal distribution, the mean a. is equal to...Ch. 6.C - In a normal distribution, data values farther from...Ch. 6.C - Consider wages at a fast food restaurant where...Ch. 6.C - In a normal distribution, about 2/3 Of the data...Ch. 6.C - Suppose a car driven under different conditions...Ch. 6.C - Consider again the car described in Question 6. On...Ch. 6.C - Consider an exam with a normal distribution of...Ch. 6.C - An acquaintance tells you that his IQ is in the...Ch. 6.C - The height of a particular 7-year-old girl has a...Ch. 6.C - 1. What is a normal distribution? Briefly describe...Ch. 6.C - 2. What is the 68-95-99.7 rule for normal...Ch. 6.C - 3. What is a standard score? How do you find the...Ch. 6.C - Prob. 4ECh. 6.C - The heights of male basketball players at Kentucky...Ch. 6.C - The weights of babies born at Belmont Hospital are...Ch. 6.C - The weights of babies born at Belmont Hospital are...Ch. 6.C - On yesterday's mathematics exam, the standard...Ch. 6.C - My professor graded the final on a curve, and she...Ch. 6.C - Jack is the 50th percentile for height, so he is...Ch. 6.C - Prob. 11ECh. 6.C - Prob. 12ECh. 6.C - Prob. 13ECh. 6.C - 13-18: Normal Distributions. State, with an...Ch. 6.C - 13-18: Normal Distributions. State, with an...Ch. 6.C - Normal Distributions. State, with an explanation,...Ch. 6.C - Prob. 17ECh. 6.C - 13-18: Normal Distributions. State, with an...Ch. 6.C - The 68-95-99.7 Rule. A set of test scores is...Ch. 6.C - The 68-95-99.7 Rule. The resting heart rates for a...Ch. 6.C - Psychology Exam. The scores on a psychology exam...Ch. 6.C - Psychology Exam. The scores on a psychology exam...Ch. 6.C - Psychology Exam. The scores on a psychology exam...Ch. 6.C - Psychology Exam. The scores on a psychology exam...Ch. 6.C - Psychology Exam. The scores on a psychology exam...Ch. 6.C - 21-28: Psychology Exam. The scores on a psychology...Ch. 6.C - 21-28: Psychology Exam. The scores on a psychology...Ch. 6.C - Psychology Exam. The scores on a psychology exam...Ch. 6.C - Standard Scores and Percentiles. Use Table 6.3 to...Ch. 6.C - Standard Scores and Percentiles. Use Table 6.3 to...Ch. 6.C - Percentiles. Use Table 6.4 to find the approximate...Ch. 6.C - Percentiles. Use Table 6.4 to find the approximate...Ch. 6.C - Pregnancy Length. Actual lengths of terms are...Ch. 6.C - Pregnancy Length. Actual lengths of terms are...Ch. 6.C - Prob. 35ECh. 6.C - Prob. 36ECh. 6.C - Heights. According to data from the National...Ch. 6.C - Body Mass Index (BMI). The body mass indexes of...Ch. 6.C - 39. Is It Likely? Suppose you read that the...Ch. 6.C - Prob. 40ECh. 6.C - GRE Scores. Scores on the verbal Graduate Record...Ch. 6.C - 41-47: GRE Scores. Scores on the verbal section of...Ch. 6.C - 41-47: GRE Scores. Scores on the verbal section of...Ch. 6.C - Prob. 44ECh. 6.C - 41-47: GRE Scores. Scores on the verbal section of...Ch. 6.C - Prob. 46ECh. 6.C - Prob. 47ECh. 6.C - Normal Distributions. Many data sets described in...Ch. 6.C - Normal Demonstration. Do a Web search on the...Ch. 6.C - Heights of American Men. The heights of American...Ch. 6.C - Normal Distributions in StatCrunch. Go to the work...Ch. 6.C - Prob. 52ECh. 6.D - Prob. 1QQCh. 6.D - Prob. 2QQCh. 6.D - Prob. 3QQCh. 6.D - Prob. 4QQCh. 6.D - A poll finds that 35% of the people surveyed...Ch. 6.D - Prob. 6QQCh. 6.D - Consider a survey with a margin of error of 4%. If...Ch. 6.D - Prob. 8QQCh. 6.D - Prob. 9QQCh. 6.D - Prob. 10QQCh. 6.D - Prob. 1ECh. 6.D - Prob. 2ECh. 6.D - Prob. 3ECh. 6.D - Prob. 4ECh. 6.D - Prob. 5ECh. 6.D - Prob. 6ECh. 6.D - Prob. 7ECh. 6.D - Prob. 8ECh. 6.D - Prob. 9ECh. 6.D - Prob. 10ECh. 6.D - Both agencies conducted their surveys carefully,...Ch. 6.D - If you want to reduce the margin of error in your...Ch. 6.D - Prob. 13ECh. 6.D - Prob. 14ECh. 6.D - Prob. 15ECh. 6.D - Subjective Significance. For each of the following...Ch. 6.D - 15-20: Subjective Significance. For each of the...Ch. 6.D - Prob. 18ECh. 6.D - Prob. 19ECh. 6.D - 15-20: Subjective Significance. For each of the...Ch. 6.D - Human Body Temperature. A study by University of...Ch. 6.D - Seat Belts and Children. In a study of children...Ch. 6.D - SAT Preparation. A study of 75 students who took...Ch. 6.D - Weight by Age. A National Health Survey determined...Ch. 6.D - Margin of Error. Find the margin of error and the...Ch. 6.D - Prob. 26ECh. 6.D - 25-32: Margin of Error. Find the margin of error...Ch. 6.D - Prob. 28ECh. 6.D - Prob. 29ECh. 6.D - 25-32: Margin of Error. Find the margin of error...Ch. 6.D - 25-32: Margin of Error. Find the margin of error...Ch. 6.D - Margin of Error. Find the margin of error and the...Ch. 6.D - 33-38: Formulating Hypotheses. Consider the...Ch. 6.D - Prob. 34ECh. 6.D - Prob. 35ECh. 6.D - Prob. 36ECh. 6.D - Prob. 37ECh. 6.D - Prob. 38ECh. 6.D -
39-44: Hypothesis Tests. The following exercises...Ch. 6.D -
39-44: Hypothesis Tests. The following exercises...Ch. 6.D -
39-44: Hypothesis Tests. The following exercises...Ch. 6.D -
39-44: Hypothesis Tests. The following exercises...Ch. 6.D -
39-44: Hypothesis Tests. The following exercises...Ch. 6.D - Prob. 44ECh. 6.D - Prob. 45ECh. 6.D - Prob. 46ECh. 6.D - Prob. 47ECh. 6.D - Better Margin of Error. Suppose you want to...Ch. 6.D - Prob. 49ECh. 6.D - Recent Polls. Visit the websites of polling...Ch. 6.D - Prob. 51ECh. 6.D - Statistical Significance. Find a recent news...Ch. 6.D - Prob. 53ECh. 6.D - Hypothesis Testing. Find a news report describing...Ch. 6.D - 55. Confidence Interval. Go to and choose...
Knowledge Booster


Learn more about
Need a deep-dive on the concept behind this application? Look no further. Learn more about this topic, subject and related others by exploring similar questions and additional content below.Similar questions
- answer number 2arrow_forward4. Linear Regression - Model Assumptions and Interpretation A real estate analyst is studying how house prices (Y) are related to house size in square feet (X). A simple linear regression model is proposed: The analyst fits the model and obtains: • Ŷ50,000+150X YBoB₁X + € • R² = 0.76 • Residuals show a fan-shaped pattern when plotted against fitted values. Questions: a) Interpret the slope coefficient in context. b) Explain what the R² value tells us about the model's performance. c) Based on the residual pattern, what regression assumption is likely violated? What might be the consequence? d) Suggest at least two remedies to improve the model, based on the residual analysis.arrow_forward5. Probability Distributions – Continuous Random Variables A factory machine produces metal rods whose lengths (in cm) follow a continuous uniform distribution on the interval [98, 102]. Questions: a) Define the probability density function (PDF) of the rod length.b) Calculate the probability that a randomly selected rod is shorter than 99 cm.c) Determine the expected value and variance of rod lengths.d) If a sample of 25 rods is selected, what is the probability that their average length is between 99.5 cm and 100.5 cm? Justify your answer using the appropriate distribution.arrow_forward
- 2. Hypothesis Testing - Two Sample Means A nutritionist is investigating the effect of two different diet programs, A and B, on weight loss. Two independent samples of adults were randomly assigned to each diet for 12 weeks. The weight losses (in kg) are normally distributed. Sample A: n = 35, 4.8, s = 1.2 Sample B: n=40, 4.3, 8 = 1.0 Questions: a) State the null and alternative hypotheses to test whether there is a significant difference in mean weight loss between the two diet programs. b) Perform a hypothesis test at the 5% significance level and interpret the result. c) Compute a 95% confidence interval for the difference in means and interpret it. d) Discuss assumptions of this test and explain how violations of these assumptions could impact the results.arrow_forward1. Sampling Distribution and the Central Limit Theorem A company produces batteries with a mean lifetime of 300 hours and a standard deviation of 50 hours. The lifetimes are not normally distributed—they are right-skewed due to some batteries lasting unusually long. Suppose a quality control analyst selects a random sample of 64 batteries from a large production batch. Questions: a) Explain whether the distribution of sample means will be approximately normal. Justify your answer using the Central Limit Theorem. b) Compute the mean and standard deviation of the sampling distribution of the sample mean. c) What is the probability that the sample mean lifetime of the 64 batteries exceeds 310 hours? d) Discuss how the sample size affects the shape and variability of the sampling distribution.arrow_forwardAn airplane flies due west at an airspeed of 428 mph. The wind blows in the direction of 41° south of west at 50 mph. What is the ground speed of the airplane? What is the bearing of the airplane? 428 mph 41° 50 mph a. The ground speed of the airplane is b. The bearing of the airplane is mph. south of west.arrow_forward
- Rylee's car is stuck in the mud. Roman and Shanice come along in a truck to help pull her out. They attach one end of a tow strap to the front of the car and the other end to the truck's trailer hitch, and the truck starts to pull. Meanwhile, Roman and Shanice get behind the car and push. The truck generates a horizontal force of 377 lb on the car. Roman and Shanice are pushing at a slight upward angle and generate a force of 119 lb on the car. These forces can be represented by vectors, as shown in the figure below. The angle between these vectors is 20.2°. Find the resultant force (the vector sum), then give its magnitude and its direction angle from the positive x-axis. 119 lb 20.2° 377 lb a. The resultant force is (Tip: omit degree notations from your answers; e.g. enter cos(45) instead of cos(45°)) b. It's magnitude is lb. c. It's angle from the positive x-axis isarrow_forwardComplete the table below. For solutions, round to the nearest whole number.arrow_forwardA biologist is investigating the effect of potential plant hormones by treating 20 stem segments. At the end of the observation period he computes the following length averages: Compound X = 1.18 Compound Y = 1.17 Based on these mean values he concludes that there are no treatment differences. 1) Are you satisfied with his conclusion? Why or why not? 2) If he asked you for help in analyzing these data, what statistical method would you suggest that he use to come to a meaningful conclusion about his data and why? 3) Are there any other questions you would ask him regarding his experiment, data collection, and analysis methods?arrow_forward
- Businessarrow_forwardAnswer first questionarrow_forwardLet the universal set be whole numbers 1 through 20 inclusive. That is, U = {1, 2, 3, 4, . . ., 19, 20}. Let A, B, and C be subsets of U. Let A be the set of all prime numbers: A = {2, 3, 5, 7, 11, 13, 17, 19} Let B be the set of all odd numbers: B = {1,3,5,7, . . ., 17, 19} Let C be the set of all square numbers: C = {1,4,9,16}arrow_forward
arrow_back_ios
SEE MORE QUESTIONS
arrow_forward_ios
Recommended textbooks for you
 Discrete Mathematics and Its Applications ( 8th I...MathISBN:9781259676512Author:Kenneth H RosenPublisher:McGraw-Hill Education
 Mathematics for Elementary Teachers with Activiti...MathISBN:9780134392790Author:Beckmann, SybillaPublisher:PEARSON
 Thinking Mathematically (7th Edition)MathISBN:9780134683713Author:Robert F. BlitzerPublisher:PEARSON
 Discrete Mathematics With ApplicationsMathISBN:9781337694193Author:EPP, Susanna S.Publisher:Cengage Learning,
 Pathways To Math Literacy (looseleaf)MathISBN:9781259985607Author:David Sobecki Professor, Brian A. MercerPublisher:McGraw-Hill Education
Discrete Mathematics and Its Applications ( 8th I...
Math
ISBN:9781259676512
Author:Kenneth H Rosen
Publisher:McGraw-Hill Education
Mathematics for Elementary Teachers with Activiti...
Math
ISBN:9780134392790
Author:Beckmann, Sybilla
Publisher:PEARSON
Thinking Mathematically (7th Edition)
Math
ISBN:9780134683713
Author:Robert F. Blitzer
Publisher:PEARSON
Discrete Mathematics With Applications
Math
ISBN:9781337694193
Author:EPP, Susanna S.
Publisher:Cengage Learning,
Pathways To Math Literacy (looseleaf)
Math
ISBN:9781259985607
Author:David Sobecki Professor, Brian A. Mercer
Publisher:McGraw-Hill Education
The Shape of Data: Distributions: Crash Course Statistics #7; Author: CrashCourse;https://www.youtube.com/watch?v=bPFNxD3Yg6U;License: Standard YouTube License, CC-BY
Shape, Center, and Spread - Module 20.2 (Part 1); Author: Mrmathblog;https://www.youtube.com/watch?v=COaid7O_Gag;License: Standard YouTube License, CC-BY
Shape, Center and Spread; Author: Emily Murdock;https://www.youtube.com/watch?v=_YyW0DSCzpM;License: Standard Youtube License