Interpretation:
The pathway for solving a “grams of A” to “grams of B” by the use of conversion factor has to be chosen from the given options.
Concept Introduction:
Using the
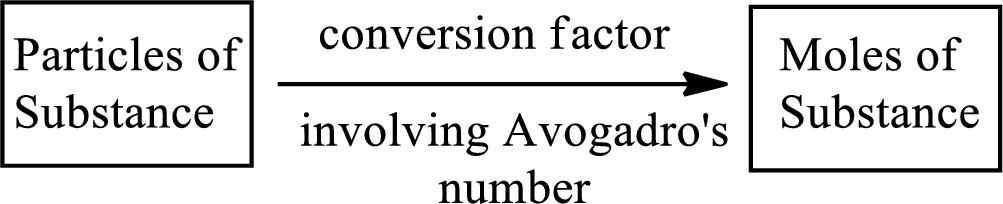
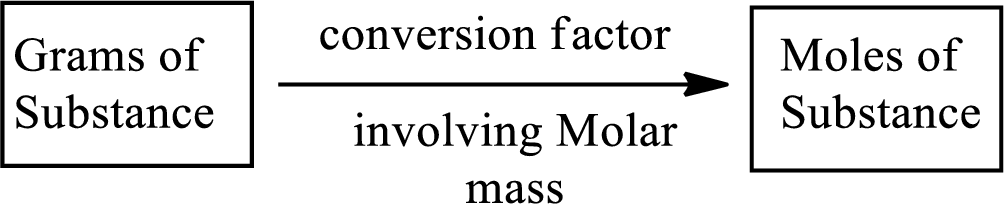
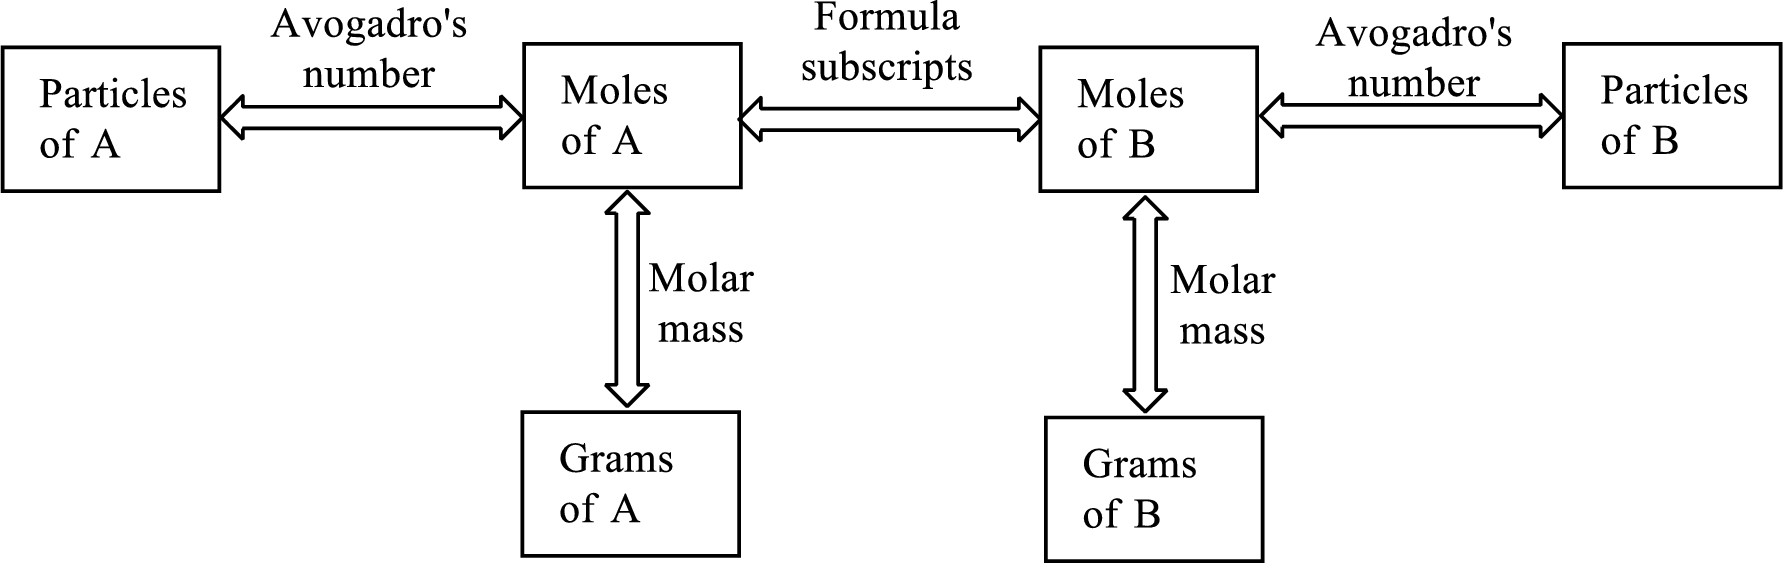
Molar mass of a substance gives a relationship between the number of grams and number of moles of that particular substance.
The Chemical formula subscript also provides relationship between the number of moles of substance to the number of moles of its individual components present in the substance.
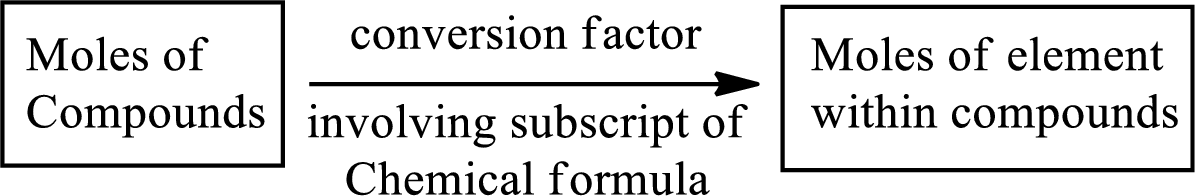
All the three above relationship can be put into a single diagram as shown below,

Trending nowThis is a popular solution!

Chapter 6 Solutions
General, Organic, And Biological Chemistry, Hybrid (with Owlv2 Quick Prep For General Chemistry Printed Access Card)

- Assign all the carbonsarrow_forward9 7 8 C 9 8 200 190 B 5 A -197.72 9 8 7 15 4 3 0: ང་ 200 190 180 147.52 134.98 170 160 150 140 130 120 110 100 90 90 OH 10 4 3 1 2 -143.04 140. 180 170 160 150 140 130 120 110 100 90 CI 3 5 1 2 141.89 140.07 200 190 180 170 160 150 140 130 120 110 100 ៖- 90 129. 126.25 80 70 60 -60 50 40 10 125.19 -129.21 80 70 3.0 20 20 -8 60 50 10 ppm -20 40 128.31 80 80 70 60 50 40 40 -70.27 3.0 20 10 ppm 00˚0-- 77.17 30 20 20 -45.36 10 ppm -0.00 26.48 22.32 ―30.10 ―-0.00arrow_forwardAssign all the carbonsarrow_forward
- C 5 4 3 CI 2 the Righ B A 5 4 3 The Lich. OH 10 4 5 3 1 LOOP- -147.52 T 77.17 -45.36 200 190 180 170 160 150 140 130 120 110 100 90 80 70 60 50 40 30 20 10 ppm B -126.25 77.03 200 190 180 170 160 150 140 130 120 110 100 90 80 70 60 50 40 30 20 10 ppm 200 190 180 170 160 150 140 130 120 110 100 90 80 TO LL <-50.00 70 60 50 40 30 20 10 ppm 45.06 30.18 -26.45 22.36 --0.00 45.07 7.5 1.93 2.05 -30.24 -22.36 C A 7 8 5 ° 4 3 7.5 7.0 6.5 6.0 5.5 5.0 4.5 4.0 3.5 3.0 2.5 2.0 1.5 1.0 ppm 9 8 5 4 3 ཡི་ OH 10 2 7.5 7.0 6.5 6.0 5.5 5.0 4.5 4.0 3.5 3.0 2.5 2.0 1.5 5 4 3 2 that th 7 I 7.0 6.5 6.0 5.5 5.0 4.5 4.0 3.5 3.0 2.5 2.0 1.5 115 2.21 4.00 1.0 ppm 6.96 2.76 5.01 1.0 ppm 6.30 1.00arrow_forwardCurved arrows were used to generate the significant resonance structure and labeled the most significant contribute. What are the errors in these resonance mechanisms. Draw out the correct resonance mechanisms with an brief explanation.arrow_forwardWhat are the: нсе * Moles of Hice while given: a) 10.0 ml 2.7M ? 6) 10.ome 12M ?arrow_forward
- You are asked to use curved arrows to generate the significant resonance structures for the following series of compounds and to label the most significant contributor. Identify the errors that would occur if you do not expand the Lewis structures or double-check the mechanisms. Also provide the correct answers.arrow_forwardhow to get limiting reactant and % yield based off this data Compound Mass 6) Volume(mL Ben zaphone-5008 ne Acetic Acid 1. Sam L 2-propanot 8.00 Benzopin- a col 030445 Benzopin a Colone 0.06743 Results Compound Melting Point (°c) Benzopin acol 172°c - 175.8 °c Benzoping to lone 1797-180.9arrow_forwardAssign ALL signals for the proton and carbon NMR spectra on the following pages.arrow_forward
- 7.5 1.93 2.05 C B A 4 3 5 The Joh. 9 7 8 1 2 7.5 7.0 6.5 6.0 5.5 5.0 4.5 4.0 3.5 3.0 2.5 2.0 1.5 1.0 ppm 9 7 8 0.86 OH 10 4 3 5 1 2 7.5 7.0 6.5 6.0 5.5 5.0 4.5 4.0 3.5 3.0 2.5 2.0 1.5 1.0 ppm 9 7 8 CI 4 3 5 1 2 7.0 6.5 6.0 5.5 5.0 4.5 4.0 3.5 3.0 2.5 2.0 2.21 4.00 1.5 2.00 2.07 1.0 ppm 2.76arrow_forwardAssign the functional group bands on the IR spectra.arrow_forwardFind the pH of a 0.120 M solution of HNO2. Find the pH ignoring activity effects (i.e., the normal way). Find the pH in a solution of 0.050 M NaCl, including activityarrow_forward
 ChemistryChemistryISBN:9781305957404Author:Steven S. Zumdahl, Susan A. Zumdahl, Donald J. DeCostePublisher:Cengage Learning
 ChemistryChemistryISBN:9781259911156Author:Raymond Chang Dr., Jason Overby ProfessorPublisher:McGraw-Hill Education
 Principles of Instrumental AnalysisChemistryISBN:9781305577213Author:Douglas A. Skoog, F. James Holler, Stanley R. CrouchPublisher:Cengage Learning
 Organic ChemistryChemistryISBN:9780078021558Author:Janice Gorzynski Smith Dr.Publisher:McGraw-Hill Education
 Chemistry: Principles and ReactionsChemistryISBN:9781305079373Author:William L. Masterton, Cecile N. HurleyPublisher:Cengage Learning
 Elementary Principles of Chemical Processes, Bind...ChemistryISBN:9781118431221Author:Richard M. Felder, Ronald W. Rousseau, Lisa G. BullardPublisher:WILEY