Videos
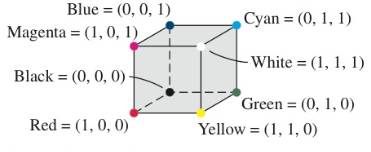
Representing Colors Colors for computer monitors are often described using ordered triples. One model, called the RGB system, uses red, green, and blue to generate all colors. The figure describes the relationships of these colors in this system. Red is (1, 0, 0), green is (0, 1, 0), and blue is (0, 0, 1). Since equal amounts of red and green combine to form yellow, yellow is represented by (1, 1, 0). Similarly, magenta (a deep reddish purple) is a mixture of blue and red and is represented by (1, 0, 1).
Cyan is (0, 1, 1), since it is a mixture of blue and green.
Another color model uses cyan, magenta, and yellow. Referred to as the CMY model, it is used in the four-color printing process for textbooks like this one. In this system, cyan is (1, 0, 0), magenta is (0, 1, 0), and yellow is (0, 0, 1).
In the CMY model, red is created by mixing magenta and yellow. Thus, red is (0, 1, 1) in this system. To convert ordered triples in the RGB model to ordered triples in the CMY model, we can use the following matrix equation. In both of these systems, color intensities vary between 0 and I. (Sources: I. Kerlow, The Art of 3-D Computer Animation and Imaging; R. Wolff.)
2. In the RGB model, rust is (0.552, 0.168, 0.066). Use the matrix equation to determine the mixture of cyan, magenta, and yellow that makes rust in the CMY model.
Want to see the full answer?
Check out a sample textbook solution
Chapter 6 Solutions
College Algebra with Modeling & Visualization, Books a la Carte Edition plus MyLab Math with Pearson eText -- Access Card Package (6th Edition)


- Evaluate the following expression and show your work to support your calculations. a). 6! b). 4! 3!0! 7! c). 5!2! d). 5!2! e). n! (n - 1)!arrow_forwardAmy and Samiha have a hat that contains two playing cards, one ace and one king. They are playing a game where they randomly pick a card out of the hat four times, with replacement. Amy thinks that the probability of getting exactly two aces in four picks is equal to the probability of not getting exactly two aces in four picks. Samiha disagrees. She thinks that the probability of not getting exactly two aces is greater. The sample space of possible outcomes is listed below. A represents an ace, and K represents a king. Who is correct?arrow_forwardConsider the exponential function f(x) = 12x. Complete the sentences about the key features of the graph. The domain is all real numbers. The range is y> 0. The equation of the asymptote is y = 0 The y-intercept is 1arrow_forward
- The graph shows Alex's distance from home after biking for x hours. What is the average rate of change from -1 to 1 for the function? 4-2 о A. -2 О B. 2 О C. 1 O D. -1 ty 6 4 2 2 0 X 2 4arrow_forwardWrite 7. √49 using rational exponents. ○ A. 57 47 B. 7 O C. 47 ○ D. 74arrow_forwardCan you check If my short explantions make sense because I want to make sure that I describe this part accuratelyarrow_forward
- 9! is 362, 880. What is 10!?arrow_forwardBruce and Krista are going to buy a new furniture set for their living room. They want to buy a couch, a coffee table, and a recliner. They have narrowed it down so that they are choosing between \[4\] couches, \[5\] coffee tables, and \[9\] recliners. How many different furniture combinations are possible?arrow_forwardCan you check if my step is correct?arrow_forward

 Algebra & Trigonometry with Analytic GeometryAlgebraISBN:9781133382119Author:SwokowskiPublisher:Cengage