
Introductory Statistics, Books a la Carte Plus NEW MyLab Statistics with Pearson eText -- Access Card Package (10th Edition)
10th Edition
ISBN: 9780134270364
Author: Neil A. Weiss
Publisher: PEARSON
expand_more
expand_more
format_list_bulleted
Videos
Textbook Question
Chapter 6.4, Problem 129E
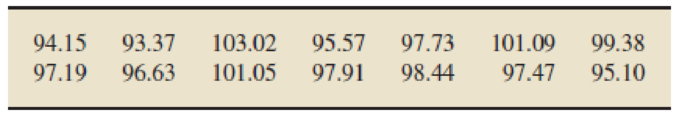
In Exercises 6.127–6.130,
- a. use Table III in Appendix A to construct a normal
probability plot of the given data. - b. use part (a) to identify any outliers.
- c. use part (a) to assess the normality of the variable under consideration.
6.129 Thoroughbred Racing. The following table displays finishing times, in seconds, for the winners of fourteen 1-mile thoroughbred horse races, as found in Thoroughbred Times.
Expert Solution & Answer
Want to see the full answer?
Check out a sample textbook solution
Students have asked these similar questions
A smallish urn contains 25 small plastic bunnies – 7 of which are pink and 18 of which are white. 10 bunnies are drawn from the urn at random with replacement, and X is the number of pink bunnies that are drawn.
(a) P(X = 5) ≈
(b) P(X<6) ≈
The Whoville small urn contains 100 marbles – 60 blue and 40 orange. The Grinch sneaks in one night and grabs a simple random sample (without replacement) of 15 marbles.
(a) The probability that the Grinch gets exactly 6 blue marbles is [ Select ] ["≈ 0.054", "≈ 0.043", "≈ 0.061"] .
(b) The probability that the Grinch gets at least 7 blue marbles is [ Select ] ["≈ 0.922", "≈ 0.905", "≈ 0.893"] .
(c) The probability that the Grinch gets between 8 and 12 blue marbles (inclusive) is [ Select ] ["≈ 0.801", "≈ 0.760", "≈ 0.786"] . The Whoville small urn contains 100 marbles – 60 blue and 40 orange. The Grinch sneaks in one night and grabs a simple random sample (without replacement) of 15 marbles.
(a)…
Suppose an experiment was conducted to compare the mileage(km) per litre
obtained by competing brands of petrol I,II,III. Three new Mazda, three new
Toyota and three new Nissan cars were available for experimentation. During the
experiment the cars would operate under same conditions in order to eliminate
the effect of external variables on the distance travelled per litre on the assigned
brand of petrol. The data is given as below:
Brands of Petrol Mazda Toyota Nissan
I 10.6 12.0 11.0
II 9.0 15.0 12.0
III 12.0 17.4 13.0
(a) Test at the 5% level of significance whether there are signi
cant differences among the brands of fuels and also among the cars. [10]
(b) Compute the standard error for comparing any two fuel brands means. Hence
compare, at the 5% level of significance, each of fuel brands II, and III with
the standard fuel brand I. [10] �
Business discuss
Chapter 6 Solutions
Introductory Statistics, Books a la Carte Plus NEW MyLab Statistics with Pearson eText -- Access Card Package (10th Edition)
Ch. 6.1 - What is a density curve?Ch. 6.1 - State the two basic properties of every density...Ch. 6.1 - For a variable with a density curve, what is the...Ch. 6.1 - In each of Exercises 6.46.11, assume that the...Ch. 6.1 - In each of Exercises 6.46.11, assume that the...Ch. 6.1 - In each of Exercises 6.46.11, assume that the...Ch. 6.1 - In each of Exercises 6.46.11, assume that the...Ch. 6.1 - In each of Exercises 6.46.11, assume that the...Ch. 6.1 - In each of Exercises 6.46.11, assume that the...Ch. 6.1 - In each of Exercises 6.46.11, assume that the...
Ch. 6.1 - In each of Exercises 6.46.11, assume that the...Ch. 6.1 - A curve has area 0.425 to the left of 4 and area...Ch. 6.1 - A curve has area 0.613 to the left of 65 and area...Ch. 6.1 - Prob. 14ECh. 6.1 - A variable is approximately normally distributed....Ch. 6.1 - Precisely what is meant by the statement that a...Ch. 6.1 - Two normally distributed variables have the same...Ch. 6.1 - Which normal distribution has a wider spread: the...Ch. 6.1 - Consider two normal distributions, one with mean 4...Ch. 6.1 - Prob. 20ECh. 6.1 - True or false: The mean of a normal distribution...Ch. 6.1 - Prob. 22ECh. 6.1 - Sketch the normal distribution with a. = 3 and =...Ch. 6.1 - Prob. 24ECh. 6.1 - For a normally distributed variable, what is the...Ch. 6.1 - Prob. 26ECh. 6.1 - Prob. 27ECh. 6.1 - The area under a particular normal curve between...Ch. 6.1 - A variable has the density curve whose equation is...Ch. 6.1 - A variable has the density curve whose equation is...Ch. 6.1 - Waiting for the Train. A commuter train arrives...Ch. 6.1 - Bacteria on a Petri Dish. A petri dish is a small,...Ch. 6.1 - Fire Loss. The loss, in millions of dollars, due...Ch. 6.1 - Emergency Room Traffic. Desert Samaritan Hospital...Ch. 6.1 - Female College Students. Refer to Example 6.3 on...Ch. 6.1 - Female College Students. Refer to Example 6.3 on...Ch. 6.1 - Giant Tarantulas. One of the larger species of...Ch. 6.1 - Serum Cholesterol Levels. According to the...Ch. 6.1 - New York City 10-km Run. As reported in Runners...Ch. 6.1 - Prob. 40ECh. 6.1 - Ages of Mothers. From the document National Vital...Ch. 6.1 - Prob. 42ECh. 6.1 - Cloudiness in Breslau. In the paper Cloudiness:...Ch. 6.1 - Prob. 44ECh. 6.1 - Prob. 45ECh. 6.1 - Prob. 46ECh. 6.1 - Chips Ahoy! 1,000 Chips Challenge. Students in an...Ch. 6.1 - Gestation Periods of Humans. Refer to the...Ch. 6.1 - Delaying Adulthood. In the paper, Delayed...Ch. 6.2 - With which normal distribution is the standard...Ch. 6.2 - Without consulting Table II, explain why the area...Ch. 6.2 - Prob. 52ECh. 6.2 - Prob. 53ECh. 6.2 - Prob. 54ECh. 6.2 - Prob. 55ECh. 6.2 - Prob. 56ECh. 6.2 - Prob. 57ECh. 6.2 - Prob. 58ECh. 6.2 - Use Table II to obtain the areas under the...Ch. 6.2 - Use Table II to obtain the areas under the...Ch. 6.2 - Use Table II to obtain the areas under the...Ch. 6.2 - Use Table II to obtain the areas under the...Ch. 6.2 - Use Table II to obtain the areas under the...Ch. 6.2 - Use Table II to obtain the areas under the...Ch. 6.2 - Use Table II to obtain the areas under the...Ch. 6.2 - Use Table II to obtain the areas under the...Ch. 6.2 - Use Table II to obtain each shaded area under the...Ch. 6.2 - Use Table II to obtain each shaded area under the...Ch. 6.2 - In each part, find the area under the standard...Ch. 6.2 - The total area under the following standard normal...Ch. 6.2 - In Exercises 6.716.82, use Table II to obtain the...Ch. 6.2 - In Exercises 6.716.82, use Table II to obtain the...Ch. 6.2 - In Exercises 6.716.82, use Table II to obtain the...Ch. 6.2 - Prob. 74ECh. 6.2 - In Exercises 6.716.82, use Table II to obtain the...Ch. 6.2 - In Exercises 6.716.82, use Table II to obtain the...Ch. 6.2 - Prob. 77ECh. 6.2 - In Exercises 6.716.82, use Table II to obtain the...Ch. 6.2 - Prob. 79ECh. 6.2 - Prob. 80ECh. 6.2 - In Exercises 6.716.82, use Table II to obtain the...Ch. 6.2 - In Exercises 6.716.82, use Table II to obtain the...Ch. 6.2 - Complete the following table.Ch. 6.2 - Prob. 84ECh. 6.2 - Prob. 85ECh. 6.3 - Briefly, for a normally distributed variable, how...Ch. 6.3 - Explain why the percentage of all possible...Ch. 6.3 - Prob. 88ECh. 6.3 - Prob. 89ECh. 6.3 - A variable is normally distributed with mean 68...Ch. 6.3 - A variable is normally distributed with mean 10...Ch. 6.3 - Prob. 92ECh. 6.3 - A variable is normally distributed with mean 6 and...Ch. 6.3 - A variable is normally distributed with mean 68...Ch. 6.3 - A variable is normally distributed with mean 10...Ch. 6.3 - A variable is normally distributed with mean 0 and...Ch. 6.3 - Giant Tarantulas. One of the larger species of...Ch. 6.3 - Serum Cholesterol Levels. According to the...Ch. 6.3 - New York City 10-km Run. As reported in Runners...Ch. 6.3 - Green Sea Urchins. From the paper Effects of...Ch. 6.3 - Arterial Cord pH. Umbilical cord blood analysis...Ch. 6.3 - Elephant Pregnancies. G. Wittemeyer et al. studied...Ch. 6.3 - Gibbon Song Duration. A preliminary behavioral...Ch. 6.3 - Friendship Motivation. In the article Assessing...Ch. 6.3 - Brain Weights. In 1905, R. Pearl published the...Ch. 6.3 - Children Watching TV. The A. C. Nielsen Company...Ch. 6.3 - Heights of Female Students. Refer to Example 6.3...Ch. 6.3 - Womens Shoes. Research reveals that foot length of...Ch. 6.3 - College-Math Success. Researchers S. Lesik and M....Ch. 6.3 - Tipping. In the article Are Christian/Religious...Ch. 6.3 - Booted Eagles. The rare booted eagle of western...Ch. 6.3 - Emergency Room Traffic. Desert Samaritan Hospital...Ch. 6.3 - Let 0 1. For a normally distributed variable,...Ch. 6.3 - Express the quartiles, Q1, Q2, and Q3, of a...Ch. 6.3 - Express the kth percentile, Pk , of a normally...Ch. 6.4 - Under what circumstances is using a normal...Ch. 6.4 - Explain why assessing the normality of a variable...Ch. 6.4 - Explain in detail what a normal probability plot...Ch. 6.4 - How is a normal probability plot used to detect...Ch. 6.4 - Explain how to obtain normal scores from Table III...Ch. 6.4 - In each of Exercises 6.1216.126, we have provided...Ch. 6.4 - In each of Exercises 6.1216.126, we have provided...Ch. 6.4 - In each of Exercises 6.1216.126, we have provided...Ch. 6.4 - In each of Exercises 6.1216.126, we have provided...Ch. 6.4 - In each of Exercises 6.1216.126, we have provided...Ch. 6.4 - Prob. 126ECh. 6.4 - In Exercises 6.1276.130, a. use Table III in...Ch. 6.4 - Prob. 128ECh. 6.4 - In Exercises 6.1276.130, a. use Table III in...Ch. 6.4 - In Exercises 6.1276.130, a. use Table III in...Ch. 6.4 - Prob. 131ECh. 6.4 - In Exercises 6.1316.134, a. obtain a normal...Ch. 6.4 - Prob. 133ECh. 6.4 - Prob. 134ECh. 6.4 - Body Temperature. A study by researchers at the...Ch. 6.4 - Vegetarians and Omnivores. Philosophical and...Ch. 6.4 - Prob. 137ECh. 6.4 - Finger Length of Criminals. In 1902, W. R....Ch. 6.4 - Prob. 139ECh. 6.4 - Emergency Room Traffic. Desert Samaritan Hospital...Ch. 6.5 - Why should you sometimes use normal-curve areas to...Ch. 6.5 - The rule of thumb for using the normal...Ch. 6.5 - In Exercises 6.1436.160, X denotes a binomial...Ch. 6.5 - In Exercises 6.1436.160, X denotes a binomial...Ch. 6.5 - In Exercises 6.1436.160, X denotes a binomial...Ch. 6.5 - In Exercises 6.1436.160, X denotes a binomial...Ch. 6.5 - In Exercises 6.1436.160, X denotes a binomial...Ch. 6.5 - In Exercises 6.1436.160, X denotes a binomial...Ch. 6.5 - In Exercises 6.1436.160, X denotes a binomial...Ch. 6.5 - In Exercises 6.1436.160, X denotes a binomial...Ch. 6.5 - In Exercises 6.1436.160, X denotes a binomial...Ch. 6.5 - In Exercises 6.1436.160, X denotes a binomial...Ch. 6.5 - In Exercises 6.1436.160, X denotes a binomial...Ch. 6.5 - In Exercises 6.1436.160, X denotes a binomial...Ch. 6.5 - In Exercises 6.1436.160, X denotes a binomial...Ch. 6.5 - In Exercises 6.1436.160, X denotes a binomial...Ch. 6.5 - Prob. 157ECh. 6.5 - Prob. 158ECh. 6.5 - In Exercises 6.1436.160, X denotes a binomial...Ch. 6.5 - In Exercises 6.1436.160, X denotes a binomial...Ch. 6.5 - TrueFalse Exams. Refer to Example 6.20 on page...Ch. 6.5 - Prob. 162ECh. 6.5 - TrueFalse Exams. If, in Example 6.20, the...Ch. 6.5 - TrueFalse Exams. If, in Example 6.20, the...Ch. 6.5 - Applying the Concepts and Skills In Exercises...Ch. 6.5 - In Exercises 6.1656.172, apply Procedure 6.3 on...Ch. 6.5 - In Exercises 6.1656.172, apply Procedure 6.3 on...Ch. 6.5 - In Exercises 6.1656.172, apply Procedure 6.3 on...Ch. 6.5 - In Exercises 6.1656.172, apply Procedure 6.3 on...Ch. 6.5 - In Exercises 6.1656.172, apply Procedure 6.3 on...Ch. 6.5 - In Exercises 6.1656.172, apply Procedure 6.3 on...Ch. 6.5 - Prob. 172ECh. 6.5 - Roulette. An American roulette wheel consists of...Ch. 6.5 - Flashlight Battery Lifetimes. A brand of...Ch. 6.5 - Prob. 175ECh. 6 - What is a density curve, and why are such curves...Ch. 6 - In each of Problems 24, assume that the variable...Ch. 6 - In each of Problems 24, assume that the variable...Ch. 6 - In each of Problems 24, assume that the variable...Ch. 6 - Prob. 5RPCh. 6 - State two of the main reasons for studying the...Ch. 6 - Prob. 7RPCh. 6 - Answer true or false to each statement. Give...Ch. 6 - Explain the relationship between percentages for a...Ch. 6 - Prob. 10RPCh. 6 - Prob. 11RPCh. 6 - Prob. 12RPCh. 6 - What key fact permits you to determine percentages...Ch. 6 - Prob. 14RPCh. 6 - Prob. 15RPCh. 6 - Prob. 16RPCh. 6 - State the empirical rule for variables.Ch. 6 - Prob. 18RPCh. 6 - Prob. 19RPCh. 6 - Prob. 20RPCh. 6 - Prob. 21RPCh. 6 - Prob. 22RPCh. 6 - For the standard normal curve, find the z-score(s)...Ch. 6 - Dispensing Coffee. A coffee machine is supposed to...Ch. 6 - Forearm Length. In 1903, K. Pearson and A. Lee...Ch. 6 - Birth Weights. The WONDER database, maintained by...Ch. 6 - Lower Limb Surgery. The study Intrathecal...Ch. 6 - Verbal GRE Scores. The Graduate Record Examination...Ch. 6 - Verbal GRE Scores. Refer to Problem 28, and fill...Ch. 6 - Prob. 30RPCh. 6 - Prob. 31RPCh. 6 - Diarrhea Vaccine. Acute rotavirus diarrhea is the...Ch. 6 - FOCUSING ON DATA ANALYSIS UWEC UNDERGRADUATES...Ch. 6 - CASE STUDY DISCUSSION CHEST SIZES OF SCOTTISH...
Additional Math Textbook Solutions
Find more solutions based on key concepts
First Derivative Test a. Locale the critical points of f. b. Use the First Derivative Test to locale the local ...
Calculus: Early Transcendentals (2nd Edition)
Empirical versus Theoretical A Monopoly player claims that the probability of getting a 4 when rolling a six-si...
Introductory Statistics
1. How is a sample related to a population?
Elementary Statistics: Picturing the World (7th Edition)
(a) Make a stem-and-leaf plot for these 24 observations on the number of customers who used a down-town CitiBan...
APPLIED STAT.IN BUS.+ECONOMICS
For Problems 23-28, write in simpler form, as in Example 4. logbFG
Finite Mathematics for Business, Economics, Life Sciences and Social Sciences
Provide an example of a qualitative variable and an example of a quantitative variable.
Elementary Statistics ( 3rd International Edition ) Isbn:9781260092561
Knowledge Booster


Learn more about
Need a deep-dive on the concept behind this application? Look no further. Learn more about this topic, statistics and related others by exploring similar questions and additional content below.Similar questions
- What would you say about a set of quantitative bivariate data whose linear correlation is -1? What would a scatter diagram of the data look like? (5 points)arrow_forwardBusiness discussarrow_forwardAnalyze the residuals of a linear regression model and select the best response. yes, the residual plot does not show a curve no, the residual plot shows a curve yes, the residual plot shows a curve no, the residual plot does not show a curve I answered, "No, the residual plot shows a curve." (and this was incorrect). I am not sure why I keep getting these wrong when the answer seems obvious. Please help me understand what the yes and no references in the answer.arrow_forward
- a. Find the value of A.b. Find pX(x) and py(y).c. Find pX|y(x|y) and py|X(y|x)d. Are x and y independent? Why or why not?arrow_forwardAnalyze the residuals of a linear regression model and select the best response.Criteria is simple evaluation of possible indications of an exponential model vs. linear model) no, the residual plot does not show a curve yes, the residual plot does not show a curve yes, the residual plot shows a curve no, the residual plot shows a curve I selected: yes, the residual plot shows a curve and it is INCORRECT. Can u help me understand why?arrow_forwardYou have been hired as an intern to run analyses on the data and report the results back to Sarah; the five questions that Sarah needs you to address are given below. please do it step by step on excel Does there appear to be a positive or negative relationship between price and screen size? Use a scatter plot to examine the relationship. Determine and interpret the correlation coefficient between the two variables. In your interpretation, discuss the direction of the relationship (positive, negative, or zero relationship). Also discuss the strength of the relationship. Estimate the relationship between screen size and price using a simple linear regression model and interpret the estimated coefficients. (In your interpretation, tell the dollar amount by which price will change for each unit of increase in screen size). Include the manufacturer dummy variable (Samsung=1, 0 otherwise) and estimate the relationship between screen size, price and manufacturer dummy as a multiple…arrow_forward
- Here is data with as the response variable. x y54.4 19.124.9 99.334.5 9.476.6 0.359.4 4.554.4 0.139.2 56.354 15.773.8 9-156.1 319.2Make a scatter plot of this data. Which point is an outlier? Enter as an ordered pair, e.g., (x,y). (x,y)= Find the regression equation for the data set without the outlier. Enter the equation of the form mx+b rounded to three decimal places. y_wo= Find the regression equation for the data set with the outlier. Enter the equation of the form mx+b rounded to three decimal places. y_w=arrow_forwardYou have been hired as an intern to run analyses on the data and report the results back to Sarah; the five questions that Sarah needs you to address are given below. please do it step by step Does there appear to be a positive or negative relationship between price and screen size? Use a scatter plot to examine the relationship. Determine and interpret the correlation coefficient between the two variables. In your interpretation, discuss the direction of the relationship (positive, negative, or zero relationship). Also discuss the strength of the relationship. Estimate the relationship between screen size and price using a simple linear regression model and interpret the estimated coefficients. (In your interpretation, tell the dollar amount by which price will change for each unit of increase in screen size). Include the manufacturer dummy variable (Samsung=1, 0 otherwise) and estimate the relationship between screen size, price and manufacturer dummy as a multiple linear…arrow_forwardExercises: Find all the whole number solutions of the congruence equation. 1. 3x 8 mod 11 2. 2x+3= 8 mod 12 3. 3x+12= 7 mod 10 4. 4x+6= 5 mod 8 5. 5x+3= 8 mod 12arrow_forward
- Scenario Sales of products by color follow a peculiar, but predictable, pattern that determines how many units will sell in any given year. This pattern is shown below Product Color 1995 1996 1997 Red 28 42 21 1998 23 1999 29 2000 2001 2002 Unit Sales 2003 2004 15 8 4 2 1 2005 2006 discontinued Green 26 39 20 22 28 14 7 4 2 White 43 65 33 36 45 23 12 Brown 58 87 44 48 60 Yellow 37 56 28 31 Black 28 42 21 Orange 19 29 Purple Total 28 42 21 49 68 78 95 123 176 181 164 127 24 179 Questions A) Which color will sell the most units in 2007? B) Which color will sell the most units combined in the 2007 to 2009 period? Please show all your analysis, leave formulas in cells, and specify any assumptions you make.arrow_forwardOne hundred students were surveyed about their preference between dogs and cats. The following two-way table displays data for the sample of students who responded to the survey. Preference Male Female TOTAL Prefers dogs \[36\] \[20\] \[56\] Prefers cats \[10\] \[26\] \[36\] No preference \[2\] \[6\] \[8\] TOTAL \[48\] \[52\] \[100\] problem 1 Find the probability that a randomly selected student prefers dogs.Enter your answer as a fraction or decimal. \[P\left(\text{prefers dogs}\right)=\] Incorrect Check Hide explanation Preference Male Female TOTAL Prefers dogs \[\blueD{36}\] \[\blueD{20}\] \[\blueE{56}\] Prefers cats \[10\] \[26\] \[36\] No preference \[2\] \[6\] \[8\] TOTAL \[48\] \[52\] \[100\] There were \[\blueE{56}\] students in the sample who preferred dogs out of \[100\] total students.arrow_forwardBusiness discussarrow_forward
arrow_back_ios
SEE MORE QUESTIONS
arrow_forward_ios
Recommended textbooks for you
 Glencoe Algebra 1, Student Edition, 9780079039897...AlgebraISBN:9780079039897Author:CarterPublisher:McGraw Hill
 Big Ideas Math A Bridge To Success Algebra 1: Stu...AlgebraISBN:9781680331141Author:HOUGHTON MIFFLIN HARCOURTPublisher:Houghton Mifflin Harcourt
 Holt Mcdougal Larson Pre-algebra: Student Edition...AlgebraISBN:9780547587776Author:HOLT MCDOUGALPublisher:HOLT MCDOUGAL
Glencoe Algebra 1, Student Edition, 9780079039897...
Algebra
ISBN:9780079039897
Author:Carter
Publisher:McGraw Hill
Big Ideas Math A Bridge To Success Algebra 1: Stu...
Algebra
ISBN:9781680331141
Author:HOUGHTON MIFFLIN HARCOURT
Publisher:Houghton Mifflin Harcourt
Holt Mcdougal Larson Pre-algebra: Student Edition...
Algebra
ISBN:9780547587776
Author:HOLT MCDOUGAL
Publisher:HOLT MCDOUGAL
Hypothesis Testing using Confidence Interval Approach; Author: BUM2413 Applied Statistics UMP;https://www.youtube.com/watch?v=Hq1l3e9pLyY;License: Standard YouTube License, CC-BY
Hypothesis Testing - Difference of Two Means - Student's -Distribution & Normal Distribution; Author: The Organic Chemistry Tutor;https://www.youtube.com/watch?v=UcZwyzwWU7o;License: Standard Youtube License