
Videos
Grade Inflation. The bar graph shows the percentage of U Scollege freshmen with an average grade of A in high school.
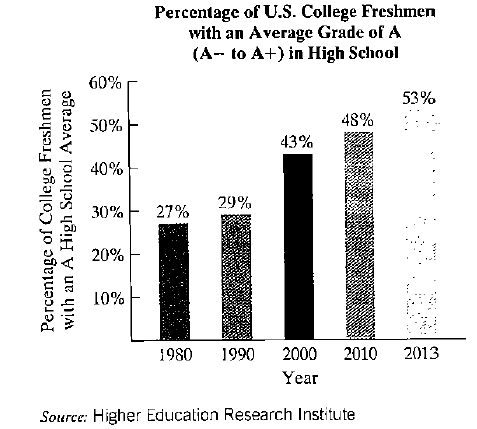
The data displayed by the bar graph can be described by themathematical model
where x is the number of years after 1980 and p is the percentage of US college freshmen who had an average grade of A in highschool. Use this information to solve Exercises 107-108.
108. a. According to the formula, in 2000, what percentage of U.S college freshmen had an average grade of A inhigh school? Docs this underestimate or overestimate the percent displayed by the bar graph’’ By howmuch?
41 % $$$ by 2%
b. If trends shown by the formula continue, project when65% of U.S. college freshmen will have had an averagegrade of A in high school. 2030
Want to see the full answer?
Check out a sample textbook solution
Chapter 6 Solutions
FD - THINKING MATHEMATICALLY MYMATHLAB
Additional Math Textbook Solutions
College Algebra (7th Edition)
Pathways To Math Literacy (looseleaf)
Precalculus
Precalculus: A Unit Circle Approach (3rd Edition)
College Algebra (Collegiate Math)
Elementary & Intermediate Algebra


- II Consider the following data matrix X: X1 X2 0.5 0.4 0.2 0.5 0.5 0.5 10.3 10 10.1 10.4 10.1 10.5 What will the resulting clusters be when using the k-Means method with k = 2. In your own words, explain why this result is indeed expected, i.e. why this clustering minimises the ESS map.arrow_forwardX Acellus | Student admin192c.acellus.com go 0:0 Hannah wants to have concrete stairs for her backdoor. How much concrete will be needed to build the stairs? 20 cm 70 cm 30 cm 15 cm 10 cm 45 cm cm 70 cm GIF 自 لاarrow_forwardwhy the answer is 3 and 10?arrow_forward
- 1 Hannah wants to have concrete stairs for her backdoor. How much concrete will be needed to build the stairs? 70 cm 30 cm 15 cm 10 cm 10 cm 20 cm 45 cm cm³ GIF GIF/ 2 3 4 qwe asdf 5 6 自 yu ty u 8 ghjk 9 P Z X C cv b vbnm ×arrow_forwardPS 9 Two films are shown on screen A and screen B at a cinema each evening. The numbers of people viewing the films on 12 consecutive evenings are shown in the back-to-back stem-and-leaf diagram. Screen A (12) Screen B (12) 8 037 34 7 6 4 0 534 74 1645678 92 71689 Key: 116|4 represents 61 viewers for A and 64 viewers for B A second stem-and-leaf diagram (with rows of the same width as the previous diagram) is drawn showing the total number of people viewing films at the cinema on each of these 12 evenings. Find the least and greatest possible number of rows that this second diagram could have. TIP On the evening when 30 people viewed films on screen A, there could have been as few as 37 or as many as 79 people viewing films on screen B.arrow_forwardskip A swimming pool plan has concrete stairs leading down into the shallow end How much concrete will be needed to build the stairs? Bift 9 ft 2 ft 1 ft 9 ft 2 ft 5 ft [ ? ] ft³arrow_forward
 Algebra: Structure And Method, Book 1AlgebraISBN:9780395977224Author:Richard G. Brown, Mary P. Dolciani, Robert H. Sorgenfrey, William L. ColePublisher:McDougal Littell
 Algebra & Trigonometry with Analytic GeometryAlgebraISBN:9781133382119Author:SwokowskiPublisher:Cengage
 Mathematics For Machine TechnologyAdvanced MathISBN:9781337798310Author:Peterson, John.Publisher:Cengage Learning,
 Big Ideas Math A Bridge To Success Algebra 1: Stu...AlgebraISBN:9781680331141Author:HOUGHTON MIFFLIN HARCOURTPublisher:Houghton Mifflin Harcourt
 Holt Mcdougal Larson Pre-algebra: Student Edition...AlgebraISBN:9780547587776Author:HOLT MCDOUGALPublisher:HOLT MCDOUGAL