Grade Inflation . The bar graph shows the percentage of UScollege freshmen with an average grade of A in high school. The data displayed by the bar graph can be described by the mathematical model P = 4 x 5 + 25 where x is the number of years after 1980 and p is the percentage of U.S. college freshmen who had an average grade of A in highschool. Use this information to solve Exercises 107-108. 107. a. According to the formula, in 2010, what percentage of U.S. college freshmen had an average grade of A in high school? Does this underestimate or overestimate the percent displayed by the bar graph? By how much? 49. % overestimates by 1% b. If trends shown by the formula continue, project when57% of US. college freshmen will have and an averagegrade of A in high school 2020
Grade Inflation . The bar graph shows the percentage of UScollege freshmen with an average grade of A in high school. The data displayed by the bar graph can be described by the mathematical model P = 4 x 5 + 25 where x is the number of years after 1980 and p is the percentage of U.S. college freshmen who had an average grade of A in highschool. Use this information to solve Exercises 107-108. 107. a. According to the formula, in 2010, what percentage of U.S. college freshmen had an average grade of A in high school? Does this underestimate or overestimate the percent displayed by the bar graph? By how much? 49. % overestimates by 1% b. If trends shown by the formula continue, project when57% of US. college freshmen will have and an averagegrade of A in high school 2020
Solution Summary: The author calculates the percentage of U.S. college freshmen who had an average grade of A in high school in year 2010.
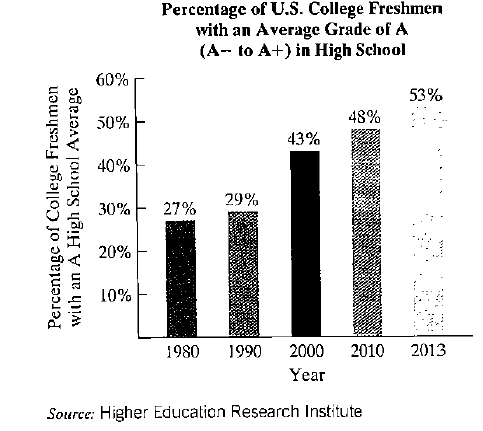
Grade Inflation. The bar graph shows the percentage of UScollege freshmen with an average grade of A in high school.
The data displayed by the bar graph can be described by the mathematical model
P
=
4
x
5
+
25
where x is the number of years after 1980 and p is the percentage of U.S. college freshmen who had an average grade of A in highschool. Use this information to solve Exercises 107-108.
107. a. According to the formula, in 2010, what percentage of U.S. college freshmen had an average grade of A in high school? Does this underestimate or overestimate the percent displayed by the bar graph? By how much? 49. % overestimates by 1%
b. If trends shown by the formula continue, project when57% of US. college freshmen will have and an averagegrade of A in high school 2020
Restart
box
ixl.com/math/grade-6/area-of-compound-figures-with-triangles
ass
BModules
Dashboard | Khan...
Grades 6-8 Life S... t Typing Lessons
BDashboard f
IXL
My IXL
Learning
Assessm
Sixth grade >GG.12 Area of compound figures with triangles 5V2
What is the area of this figure?
4 km
2 km
5 km
4 km
2 km
Learn with an example
13 km
Write your answer using decimals, if necessary.
square kilometers
Submit
Area of compound figures
Area of triangles (74)
Work it out
Not feeling ready yet? Thes
The diagonals of rhombus ABCD intersect at E. Given that BAC=53 degrees, DE=8, and EC=6 find AE
Not use ai please
Chapter 6 Solutions
Thinking Mathematically, Books a la Carte Plus MyLab Math -- Access Card Package (7th Edition)
Finite Mathematics for Business, Economics, Life Sciences and Social Sciences
Knowledge Booster
Learn more about
Need a deep-dive on the concept behind this application? Look no further. Learn more about this topic, subject and related others by exploring similar questions and additional content below.


 Algebra: Structure And Method, Book 1AlgebraISBN:9780395977224Author:Richard G. Brown, Mary P. Dolciani, Robert H. Sorgenfrey, William L. ColePublisher:McDougal Littell
 Holt Mcdougal Larson Pre-algebra: Student Edition...AlgebraISBN:9780547587776Author:HOLT MCDOUGALPublisher:HOLT MCDOUGAL
 College Algebra (MindTap Course List)AlgebraISBN:9781305652231Author:R. David Gustafson, Jeff HughesPublisher:Cengage Learning
 Algebra & Trigonometry with Analytic GeometryAlgebraISBN:9781133382119Author:SwokowskiPublisher:Cengage
 Big Ideas Math A Bridge To Success Algebra 1: Stu...AlgebraISBN:9781680331141Author:HOUGHTON MIFFLIN HARCOURTPublisher:Houghton Mifflin Harcourt