
Concept explainers
Videos
School days: The following table presents the numbers of students enrolled in grades 1 through 8 in public schools in the United States.
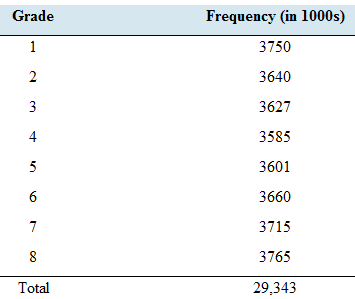
Consider these students to be a population. Let X be the grade of a student randomly chosen from this population.
Construct the
Find the probability that the student is in fourth grade.
Find the probability that the student is seventh or eighth grade.
Compute the
Compute the standard
a.
To construct: The probability distribution of the given random variable.
Explanation of Solution
The enrollment of students from grade
Calculation:
The random variable
To calculate the probability of each value of the random variable, the frequency should be divided by the total number of individuals according to the formula,
As an example,
The all calculation can be expressed in a table as follows. Because both values in the numerator and the denominator is in thousands, in the division those are cancelled out.
The probability distribution can be constructed by the first and third columns of the above table.
b.
To find: The probability to a selected student is from grade four.
Answer to Problem 49E
The probability that the student is in fourth grade is found to be
Explanation of Solution
The probability distribution for the grade of
Calculation:
When a student is fin grade four, the random variable
The relevant probability is calculated in a precious part as,
Conclusion:
The probability of
c.
To find: The probability to a selected student is in grade seven or eight.
Answer to Problem 49E
The probability that the student is seventh or eighth grade is found to be
Explanation of Solution
The probability distribution for the grade of
Calculation:
Same student cannot enroll to two different grades. Hence, being a grade seven student and being a grade eight student are two mutually exclusive events.
Therefore, the probability for this combination can be written as,
By the addition rule, this probability should be equal to
The total probability can be determined as,
Conclusion:
The probability of
d.
To find: The mean of grade of the student.
Answer to Problem 49E
The mean is found to be,
Explanation of Solution
The probability distribution for the grade of
Calculation:
The mean of a random variable, or equivalently the expected value is given by the sum of the product of the values and the corresponding probabilities.
Here, for each value of
Conclusion:
The mean is found to be
e.
To find: The standard deviation of
Answer to Problem 49E
The standard deviation is found to be,
Explanation of Solution
The probability distribution for the grade of
Calculation:
The variance of a random variable
By constructing a table we can do the calculations clearly using the mean of
The sum of right-most column gives the variation of
The standard deviation
Conclusion:
The standard deviation is found to be
Want to see more full solutions like this?
Chapter 6 Solutions
Elementary Statistics (Text Only)


- please find the answers for the yellows boxes using the information and the picture belowarrow_forwardA marketing agency wants to determine whether different advertising platforms generate significantly different levels of customer engagement. The agency measures the average number of daily clicks on ads for three platforms: Social Media, Search Engines, and Email Campaigns. The agency collects data on daily clicks for each platform over a 10-day period and wants to test whether there is a statistically significant difference in the mean number of daily clicks among these platforms. Conduct ANOVA test. You can provide your answer by inserting a text box and the answer must include: also please provide a step by on getting the answers in excel Null hypothesis, Alternative hypothesis, Show answer (output table/summary table), and Conclusion based on the P value.arrow_forwardA company found that the daily sales revenue of its flagship product follows a normal distribution with a mean of $4500 and a standard deviation of $450. The company defines a "high-sales day" that is, any day with sales exceeding $4800. please provide a step by step on how to get the answers Q: What percentage of days can the company expect to have "high-sales days" or sales greater than $4800? Q: What is the sales revenue threshold for the bottom 10% of days? (please note that 10% refers to the probability/area under bell curve towards the lower tail of bell curve) Provide answers in the yellow cellsarrow_forward
- Business Discussarrow_forwardThe following data represent total ventilation measured in liters of air per minute per square meter of body area for two independent (and randomly chosen) samples. Analyze these data using the appropriate non-parametric hypothesis testarrow_forwardeach column represents before & after measurements on the same individual. Analyze with the appropriate non-parametric hypothesis test for a paired design.arrow_forward
 Glencoe Algebra 1, Student Edition, 9780079039897...AlgebraISBN:9780079039897Author:CarterPublisher:McGraw Hill