
Concept explainers
Videos
Many times in statistics it is necessary to see if a set of data values is approximately
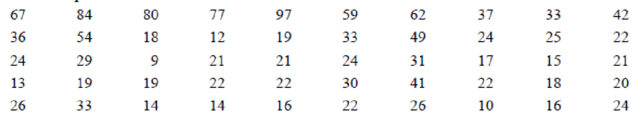
The numbers of branches of the 50 top banks are shown.
1. Construct a frequency distribution for the data.
2. Construct a histogram for the data.
3. Describe the shape of the histogram.
4. Based on your answer to question 3, do you feel that the distribution is approximately normal?
In addition to the histogram, distributions that are approximately normal have about 68% of the values fall within 1 standard deviation of the
5. Find the mean and standard deviation for the data.
6. What percent of the data values fall within 1 standard deviation of the mean?
7. What percent of the data values fall within 2 standard deviations of the mean?
8. What percent of the data values fall within 3 standard deviations of the mean?
9. How do your answers to questions 6, 7, and 8 compare to 68, 95, and 100%, respectively?
10. Does your answer help support the conclusion you reached in question 4? Explain.
1.
To construct: The frequency distribution for the data.
Answer to Problem 1AC
The frequency distribution for the data is,
| Limits | Frequency |
| 0-9 | 1 |
| 10-19 | 14 |
| 20-29 | 17 |
| 30-39 | 7 |
| 40-49 | 3 |
| 50-59 | 2 |
| 60-69 | 2 |
| 70-79 | 1 |
| 80-89 | 2 |
| 90-99 | 1 |
Explanation of Solution
Given info:
The data shows that the number of branches of the 50 top banks.
Calculation:
Answers may vary; one of the possible answers is given below.
First consider the limits with the difference of 9.
The limits are 0-9, 10-19, 20-29, 30-39, 40-49, 50-59, 60-69, 70-79, 80-89 and 90-99.
From the data, it can be observed that the number banks having branches between 0-9 is 1. Also, the number banks having branches between 10-19 is 14.
Similarly, the frequencies of other classes are obtained as follows.
| Limits | Frequency |
| 0-9 | 1 |
| 10-19 | 14 |
| 20-29 | 17 |
| 30-39 | 7 |
| 40-49 | 3 |
| 50-59 | 2 |
| 60-69 | 2 |
| 70-79 | 1 |
| 80-89 | 2 |
| 90-99 | 1 |
2.
To construct: The histogram for the data.
Answer to Problem 1AC
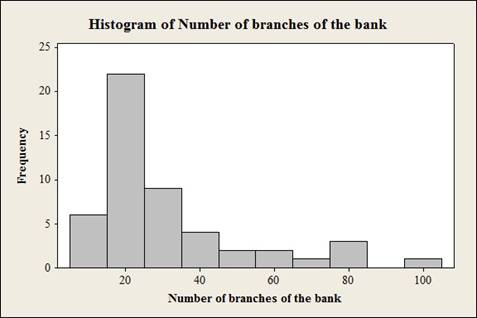
The histogram for the data is,
Explanation of Solution
Calculation:
Step-by-step procedure to obtain histogram using the MINITAB software:
- Choose Graph > Histogram.
- Choose Simple, and then click OK.
- In Graph variables, enter the column of Number of branches of the bank.
- Click OK.
3.
To describe: The shape of the histogram.
Answer to Problem 1AC
The shape of the histogram is unimodel and skewed to the right.
Explanation of Solution
Justification:
From the histogram of part (2), it can be observed that the data has single group and the bar in histogram starts with a high value which is gradually decreasing to the minimum value. Thus, it can be conclude that shape of the histogram is unimodel and skewed to the right.
4.
To check: Whether the distribution is approximately normal or not based on the answer of question 3.
Answer to Problem 1AC
No, the distribution is not approximately normal.
Explanation of Solution
Justification:
From the part (3), it can be observed shape of the histogram is unimodel and skewed to the right. Thus, it can be conclude that the distribution does not appear to be normal.
5.
To find: The mean and standard deviation for the data.
Answer to Problem 1AC
The mean and standard deviation for the data are 31.4 and 20.6.
Explanation of Solution
Calculation:
- Choose Stat > Basic Statistics > Display Descriptive Statistics.
- In Variables enter the columns Variable.
- Choose option statistics, and select Mean and Standard deviation.
- Click OK.
Output using Minitab software is,
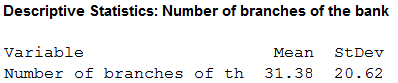
Form the Minitab output, it can be observed that the mean and standard deviation for the data are approximately 31.4 and 20.6.
6.
To find: The percent of the data values fall within 1 standard deviation of the mean.
Answer to Problem 1AC
The percent of the data values fall within 1 standard deviation of the mean is 80%.
Explanation of Solution
Calculation:
Here, 1 standard deviation of the mean represents that
Substitute 31.4 for
For
For
The percentage of the data values fall within 1 standard deviation of the mean represents the percentage of the data values lies between 10.8 and 52.
The formula for the percentage of the data values fall within 1 standard deviation of the mean is,
Substitute 40 for “Number of data values lies within 10.8 and 52” and 50 for “Total number of data values”
Thus, the percent of the data values fall within 1 standard deviation of the mean is 80%.
7.
To find: The percent of the data values fall within 2 standard deviation of the mean.
Answer to Problem 1AC
The percent of the data values fall within 2 standard deviation of the mean is 92%.
Explanation of Solution
Calculation:
Here, 2 standard deviation of the mean represents that
Substitute 31.4 for
For
For
The percentage of the data values fall within 2 standard deviation of the mean represents the percentage of the data values lies between –9.8 and 72.6.
The formula for the percentage of the data values fall within 2 standard deviation of the mean is,
Substitute 46 for “Number of data values lies within –9.8 and 72.6” and 50 for “Total number of data values”
Thus, the percent of the data values fall within 2 standard deviation of the mean is 92%.
8.
To find: The percent of the data values fall within 3 standard deviation of the mean.
Answer to Problem 1AC
The percent of the data values fall within 3 standard deviation of the mean is 98%.
Explanation of Solution
Calculation:
Here, 3 standard deviation of the mean represents that
Substitute 31.4 for
For
For
The percentage of the data values fall within 3 standard deviation of the mean represents the percentage of the data values lies between –30.4 and 93.2.
The formula for the percentage of the data values fall within 3 standard deviation of the mean is,
Substitute 49 for “Number of data values lies within –30.4 and 93.2” and 50 for “Total number of data values”
Thus, the percent of the data values fall within 3 standard deviation of the mean is 98%.
9.
To compare: The 6,7 and 8 answers with the 68, 95 and 100%.
Answer to Problem 1AC
The 6,7 and 8 answers are different with the 68, 95 and 100%.
Explanation of Solution
Calculation:
From the answers of 6,7 and 8, it is observed that the percent of the data values fall within 1,2 and 3 standard deviation of the mean are 80%, 92% and 98%. Thus, it can be conclude that the 6,7 and 8 answers are different with the 68, 95 and 100%.
10.
To explain: Whether the answer help to support the conclusion in question 4.
Answer to Problem 1AC
Yes, the answer help to support the conclusion in question 4 because the distribution of the variable does not follow normal distribution.
Explanation of Solution
Calculation:
From the answer of (9), it can be observed that the distribution of the variable does not follow normal distribution. Thus, it can be concluding that the answer help to support the conclusion in question 4.
Want to see more full solutions like this?
Chapter 6 Solutions
Connect Plus Statistics Hosted by ALEKS Access Card 52 Weeks for Elementary Statistics: A Step-By-St
Additional Math Textbook Solutions
Math in Our World
Elementary Statistics ( 3rd International Edition ) Isbn:9781260092561
APPLIED STAT.IN BUS.+ECONOMICS
Introductory Statistics
Basic College Mathematics
Elementary Statistics: Picturing the World (7th Edition)


- Should you be confident in applying your regression equation to estimate the heart rate of a python at 35°C? Why or why not?arrow_forwardGiven your fitted regression line, what would be the residual for snake #5 (10 C)?arrow_forwardCalculate the 95% confidence interval around your estimate of r using Fisher’s z-transformation. In your final answer, make sure to back-transform to the original units.arrow_forward
- BUSINESS DISCUSSarrow_forwardA researcher wishes to estimate, with 90% confidence, the population proportion of adults who support labeling legislation for genetically modified organisms (GMOs). Her estimate must be accurate within 4% of the true proportion. (a) No preliminary estimate is available. Find the minimum sample size needed. (b) Find the minimum sample size needed, using a prior study that found that 65% of the respondents said they support labeling legislation for GMOs. (c) Compare the results from parts (a) and (b). ... (a) What is the minimum sample size needed assuming that no prior information is available? n = (Round up to the nearest whole number as needed.)arrow_forwardThe table available below shows the costs per mile (in cents) for a sample of automobiles. At a = 0.05, can you conclude that at least one mean cost per mile is different from the others? Click on the icon to view the data table. Let Hss, HMS, HLS, Hsuv and Hмy represent the mean costs per mile for small sedans, medium sedans, large sedans, SUV 4WDs, and minivans respectively. What are the hypotheses for this test? OA. Ho: Not all the means are equal. Ha Hss HMS HLS HSUV HMV B. Ho Hss HMS HLS HSUV = μMV Ha: Hss *HMS *HLS*HSUV * HMV C. Ho Hss HMS HLS HSUV =μMV = = H: Not all the means are equal. D. Ho Hss HMS HLS HSUV HMV Ha Hss HMS HLS =HSUV = HMVarrow_forward
 Holt Mcdougal Larson Pre-algebra: Student Edition...AlgebraISBN:9780547587776Author:HOLT MCDOUGALPublisher:HOLT MCDOUGAL
 Glencoe Algebra 1, Student Edition, 9780079039897...AlgebraISBN:9780079039897Author:CarterPublisher:McGraw Hill
 Big Ideas Math A Bridge To Success Algebra 1: Stu...AlgebraISBN:9781680331141Author:HOUGHTON MIFFLIN HARCOURTPublisher:Houghton Mifflin Harcourt
 Functions and Change: A Modeling Approach to Coll...AlgebraISBN:9781337111348Author:Bruce Crauder, Benny Evans, Alan NoellPublisher:Cengage Learning