
Videos
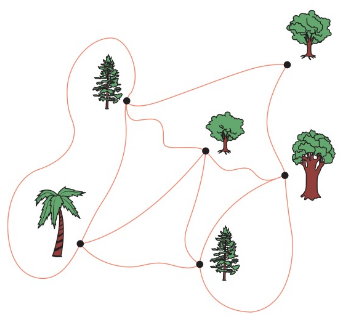
Walking the dogs. Your dogs, Abbey and Bear, love to walk in the town park, modeled with the graph below. Based on the drawing, what do the vertices in this graph represent? What do the edges represent? Abbey and Bear recently learned about Euler circuits and try to traverse each edge exactly once during thcir walk (as they visit many trees more than once). Will they be successful?
Want to see the full answer?
Check out a sample textbook solution
Chapter 6 Solutions
The Heart of Mathematics: An Invitation to Effective Thinking, WileyPLUS NextGen Card with Loose-leaf Set Single Semester: An Invitation to Effective Thinking (Key Curriculum Press)
Additional Math Textbook Solutions
Introductory Statistics
Probability And Statistical Inference (10th Edition)
Elementary Statistics
Intro Stats, Books a la Carte Edition (5th Edition)
Basic Business Statistics, Student Value Edition


- In x For the function f(x) = find f'(x). Then find f''(0) and f''(9). 11x'arrow_forwardLet f(x) = √√x+3 and g(x) = 6x − 2. Find each of the following composite functions and state the domain: (a) fog (b) gof, (c) fof (d) gogarrow_forwardCompute the following: (a) 8x³ + 3x dx (b) cos(2u) du (c) f² ebx dxarrow_forward
- Find the following limits. (a) lim 3(x-1)² x→2 x (b) lim 0+x (c) lim 3x2-x+1 x²+3 x²+x-12 x-3 x-3arrow_forwardFor f(x) = (x+3)² - 2 sketch f(x), f(x), f(x − 2), and f(x) — 2. State the coordi- nates of the turning point in each graph.arrow_forwardif the b coloumn of a z table disappeared what would be used to determine b column probabilitiesarrow_forward
- Construct a model of population flow between metropolitan and nonmetropolitan areas of a given country, given that their respective populations in 2015 were 263 million and 45 million. The probabilities are given by the following matrix. (from) (to) metro nonmetro 0.99 0.02 metro 0.01 0.98 nonmetro Predict the population distributions of metropolitan and nonmetropolitan areas for the years 2016 through 2020 (in millions, to four decimal places). (Let x, through x5 represent the years 2016 through 2020, respectively.) x₁ = x2 X3 261.27 46.73 11 259.59 48.41 11 257.96 50.04 11 256.39 51.61 11 tarrow_forwardFill in all the justifications to complete this formal proof, following all conventions from the textbook. 1. Ax~Q(x) 2. Ax(Q(x)vR(x)) 3. @n Premise Premise 4. | ~Q(n) 5. | Q(n)vR(n) 6. || Q(n) 7. || # 8. || R(n) 9. || R(n) 10. | R(n) 11. AxR(x)arrow_forwardFor f(x) = (x+3)² - 2 sketch f(x), f(x), f(x − 2), and f(x) — 2. State the coordi- nates of the turning point in each graph.arrow_forward
 Algebra & Trigonometry with Analytic GeometryAlgebraISBN:9781133382119Author:SwokowskiPublisher:Cengage
 Holt Mcdougal Larson Pre-algebra: Student Edition...AlgebraISBN:9780547587776Author:HOLT MCDOUGALPublisher:HOLT MCDOUGAL
 Algebra: Structure And Method, Book 1AlgebraISBN:9780395977224Author:Richard G. Brown, Mary P. Dolciani, Robert H. Sorgenfrey, William L. ColePublisher:McDougal Littell
 Glencoe Algebra 1, Student Edition, 9780079039897...AlgebraISBN:9780079039897Author:CarterPublisher:McGraw Hill
 Big Ideas Math A Bridge To Success Algebra 1: Stu...AlgebraISBN:9781680331141Author:HOUGHTON MIFFLIN HARCOURTPublisher:Houghton Mifflin Harcourt
 College Algebra (MindTap Course List)AlgebraISBN:9781305652231Author:R. David Gustafson, Jeff HughesPublisher:Cengage Learning