EBK INTRODUCTION TO THE PRACTICE OF STA
9th Edition
ISBN: 8220103674638
Author: Moore
Publisher: YUZU
bartleby

Videos

Question
Book Icon
Chapter 6.1, Problem 14E

Section 1

To determine

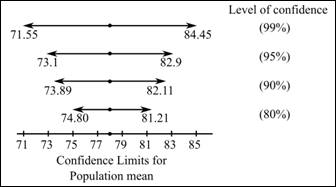
To graph: The diagram that illustrates the effect of the confidence level on the width of the interval.

Section 1

Expert Solution
Check Mark

Explanation of Solution

Calculation: The confidence intervals based on different sample sizes need to be determined in order to draw the required diagram. The lower and upper bounds of the confidence interval for the population mean μ, at a significance level of α is calculated using the following formula:

Lower bound = x¯m=x¯Zα2×σn

And,

Upper bound = x¯+m=x¯+Zα2×σn

Where x¯ and m represent the sample mean and margin of error respectively and σ denotes the population standard deviation and n is the size of the sample. Zα2 is the critical value of the standard normal distribution at a significance level of α, whose value is obtained from Table A provided in the book. For a confidence level of 80%, the level of significance α=0.20. Therefore,

Lower bound = x¯Zα/2×σn=78Z0.20/2×2064=781.282×2064=74.80

And,

Upper bound = x¯+Zα/2×σn=78+Z0.20/2×2064=78+1.282×2064=81.21

Therefore, the required confidence interval is (74.80,81.21).

For a confidence level of 90%, the level of significance α=0.10. Therefore,

Lower bound = x¯Zα2×σn=78Z0.102×2064=781.645×2064=73.89

And,

Upper bound = x¯+Zα2×σn=78+Z0.102×2064=78+1.645×2064=82.11

Therefore, the required confidence interval is (73.89,82.11). For a confidence level of 95%, the level of significance α=0.05. Therefore,

Lower bound = x¯Zα2×σn=78Z0.052×2064=781.96×2064=73.1

And,

Upper bound = x¯+Zα2×σn=78+Z0.052×2064=78+1.96×2064=82.9

Therefore, the required confidence interval is (73.1,82.9). For a confidence level of 99%, the level of significance α=0.01. Therefore,

Lower bound = x¯Zα2×σn=78Z0.012×2064=782.58×2064=71.55

And,

Upper bound = x¯+Zα2×σn=78+Z0.012×2064=78+2.58×2064=84.45

Therefore, the required confidence interval is (71.55,84.45). Hence, the diagram which shows the effect of the confidence level on the width of the interval is shown below:

Graph:

EBK INTRODUCTION TO THE PRACTICE OF STA, Chapter 6.1, Problem 14E

Section 2

To determine

To explain: The results.

Section 2

Expert Solution
Check Mark

Answer to Problem 14E

Solution: The width of the confidence interval expands due to hike in the level of confidence.

Explanation of Solution

The margin of error rises with a rise in the confidence level because there is a direct relationship between the level of confidence and margin of error. This leads to an expansion in the width of the confidence interval. Hence, it can be concluded that as level of confidence increases, the width of the confidence interval increases.

Want to see more full solutions like this?

Subscribe now to access step-by-step solutions to millions of textbook problems written by subject matter experts!
Students have asked these similar questions
please find the answers for the yellows boxes using the information and the picture below
A marketing agency wants to determine whether different advertising platforms generate significantly different levels of customer engagement. The agency measures the average number of daily clicks on ads for three platforms: Social Media, Search Engines, and Email Campaigns. The agency collects data on daily clicks for each platform over a 10-day period and wants to test whether there is a statistically significant difference in the mean number of daily clicks among these platforms. Conduct ANOVA test. You can provide your answer by inserting a text box and the answer must include: also please provide a step by on getting the answers in excel Null hypothesis, Alternative hypothesis, Show answer (output table/summary table), and Conclusion based on the P value.
A company found that the daily sales revenue of its flagship product follows a normal distribution with a mean of $4500 and a standard deviation of $450. The company defines a "high-sales day" that is, any day with sales exceeding $4800. please provide a step by step on how to get the answers Q: What percentage of days can the company expect to have "high-sales days" or sales greater than $4800? Q: What is the sales revenue threshold for the bottom 10% of days? (please note that 10% refers to the probability/area under bell curve towards the lower tail of bell curve) Provide answers in the yellow cells

Chapter 6 Solutions

EBK INTRODUCTION TO THE PRACTICE OF STA

Ch. 6.1 - Prob. 11UYKCh. 6.1 - Prob. 12ECh. 6.1 - Prob. 13ECh. 6.1 - Prob. 14ECh. 6.1 - Prob. 15ECh. 6.1 - Prob. 16ECh. 6.1 - Prob. 17ECh. 6.1 - Prob. 18ECh. 6.1 - Prob. 19ECh. 6.1 - Prob. 20ECh. 6.1 - Prob. 21ECh. 6.1 - Prob. 22ECh. 6.1 - Prob. 23ECh. 6.1 - Prob. 24ECh. 6.1 - Prob. 25ECh. 6.1 - Prob. 26ECh. 6.1 - Prob. 27ECh. 6.1 - Prob. 28ECh. 6.1 - Prob. 29ECh. 6.1 - Prob. 30ECh. 6.1 - Prob. 31ECh. 6.1 - Prob. 32ECh. 6.1 - Prob. 33ECh. 6.1 - Prob. 34ECh. 6.1 - Prob. 35ECh. 6.1 - Prob. 36ECh. 6.1 - Prob. 37ECh. 6.2 - Prob. 38UYKCh. 6.2 - Prob. 39UYKCh. 6.2 - Prob. 40UYKCh. 6.2 - Prob. 41UYKCh. 6.2 - Prob. 42UYKCh. 6.2 - Prob. 43UYKCh. 6.2 - Prob. 44UYKCh. 6.2 - Prob. 45UYKCh. 6.2 - Prob. 46UYKCh. 6.2 - Prob. 47UYKCh. 6.2 - Prob. 48UYKCh. 6.2 - Prob. 49UYKCh. 6.2 - Prob. 50UYKCh. 6.2 - Prob. 51UYKCh. 6.2 - Prob. 52ECh. 6.2 - Prob. 53ECh. 6.2 - Prob. 54ECh. 6.2 - Prob. 55ECh. 6.2 - Prob. 56ECh. 6.2 - Prob. 57ECh. 6.2 - Prob. 58ECh. 6.2 - Prob. 59ECh. 6.2 - Prob. 60ECh. 6.2 - Prob. 61ECh. 6.2 - Prob. 62ECh. 6.2 - Prob. 63ECh. 6.2 - Prob. 64ECh. 6.2 - Prob. 65ECh. 6.2 - Prob. 66ECh. 6.2 - Prob. 67ECh. 6.2 - Prob. 68ECh. 6.2 - Prob. 69ECh. 6.2 - Prob. 70ECh. 6.2 - Prob. 71ECh. 6.2 - Prob. 72ECh. 6.2 - Prob. 73ECh. 6.2 - Prob. 74ECh. 6.2 - Prob. 75ECh. 6.2 - Prob. 76ECh. 6.2 - Prob. 77ECh. 6.2 - Prob. 78ECh. 6.2 - Prob. 79ECh. 6.2 - Prob. 80ECh. 6.2 - Prob. 81ECh. 6.2 - Prob. 82ECh. 6.2 - Prob. 83ECh. 6.2 - Prob. 84ECh. 6.2 - Prob. 85ECh. 6.2 - Prob. 86ECh. 6.2 - Prob. 87ECh. 6.2 - Prob. 88ECh. 6.2 - Prob. 89ECh. 6.3 - Prob. 90UYKCh. 6.3 - Prob. 91UYKCh. 6.3 - Prob. 92ECh. 6.3 - Prob. 93ECh. 6.3 - Prob. 94ECh. 6.3 - Prob. 95ECh. 6.3 - Prob. 96ECh. 6.3 - Prob. 97ECh. 6.3 - Prob. 98ECh. 6.3 - Prob. 99ECh. 6.3 - Prob. 100ECh. 6.3 - Prob. 101ECh. 6.3 - Prob. 102ECh. 6.3 - Prob. 103ECh. 6.3 - Prob. 104ECh. 6.3 - Prob. 105ECh. 6.3 - Prob. 106ECh. 6.3 - Prob. 107ECh. 6.3 - Prob. 108ECh. 6.3 - Prob. 109ECh. 6.4 - Prob. 110ECh. 6.4 - Prob. 111ECh. 6.4 - Prob. 112ECh. 6.4 - Prob. 113ECh. 6.4 - Prob. 114ECh. 6.4 - Prob. 115ECh. 6.4 - Prob. 116ECh. 6.4 - Prob. 117ECh. 6.4 - Prob. 118ECh. 6.4 - Prob. 119ECh. 6.4 - Prob. 120ECh. 6.4 - Prob. 121ECh. 6.4 - Prob. 122ECh. 6.4 - Prob. 123ECh. 6 - Prob. 124ECh. 6 - Prob. 125ECh. 6 - Prob. 126ECh. 6 - Prob. 127ECh. 6 - Prob. 128ECh. 6 - Prob. 129ECh. 6 - Prob. 130ECh. 6 - Prob. 131ECh. 6 - Prob. 132ECh. 6 - Prob. 133ECh. 6 - Prob. 134ECh. 6 - Prob. 135ECh. 6 - Prob. 136ECh. 6 - Prob. 137ECh. 6 - Prob. 138ECh. 6 - Prob. 139ECh. 6 - Prob. 140ECh. 6 - Prob. 141ECh. 6 - Prob. 142ECh. 6 - Prob. 143ECh. 6 - Prob. 144E
Knowledge Booster
Background pattern image
Statistics
Learn more about
Need a deep-dive on the concept behind this application? Look no further. Learn more about this topic, statistics and related others by exploring similar questions and additional content below.
Recommended textbooks for you
Text book image
MATLAB: An Introduction with Applications
Statistics
ISBN:9781119256830
Author:Amos Gilat
Publisher:John Wiley & Sons Inc
Text book image
Probability and Statistics for Engineering and th...
Statistics
ISBN:9781305251809
Author:Jay L. Devore
Publisher:Cengage Learning
Text book image
Statistics for The Behavioral Sciences (MindTap C...
Statistics
ISBN:9781305504912
Author:Frederick J Gravetter, Larry B. Wallnau
Publisher:Cengage Learning
Text book image
Elementary Statistics: Picturing the World (7th E...
Statistics
ISBN:9780134683416
Author:Ron Larson, Betsy Farber
Publisher:PEARSON
Text book image
The Basic Practice of Statistics
Statistics
ISBN:9781319042578
Author:David S. Moore, William I. Notz, Michael A. Fligner
Publisher:W. H. Freeman
Text book image
Introduction to the Practice of Statistics
Statistics
ISBN:9781319013387
Author:David S. Moore, George P. McCabe, Bruce A. Craig
Publisher:W. H. Freeman
F- Test or F- statistic (F- Test of Equality of Variance); Author: Prof. Arvind Kumar Sing;https://www.youtube.com/watch?v=PdUt7InTyc8;License: Standard Youtube License
Statistics 101: F-ratio Test for Two Equal Variances; Author: Brandon Foltz;https://www.youtube.com/watch?v=UWQO4gX7-lE;License: Standard YouTube License, CC-BY
Hypothesis Testing and Confidence Intervals (FRM Part 1 – Book 2 – Chapter 5); Author: Analystprep;https://www.youtube.com/watch?v=vth3yZIUlGQ;License: Standard YouTube License, CC-BY
Understanding the Levene's Test for Equality of Variances in SPSS; Author: Dr. Todd Grande;https://www.youtube.com/watch?v=udJr8V2P8Xo;License: Standard Youtube License