
Concept explainers
Videos
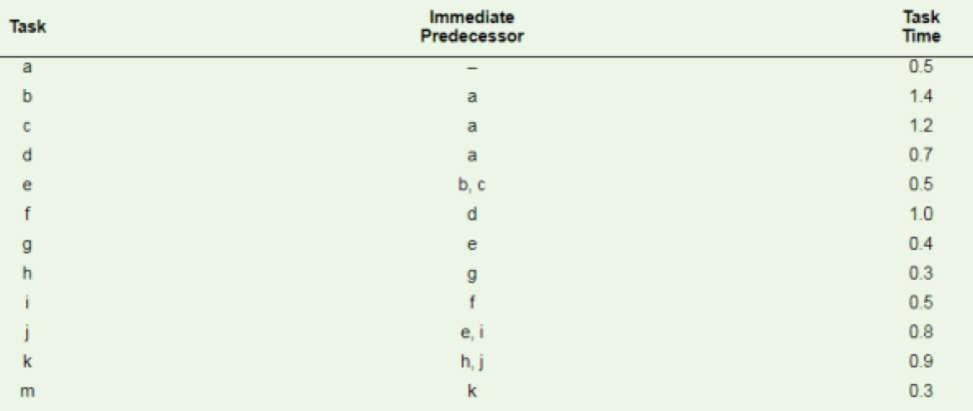
A shop works a 400-minute day. The manager of the shop wants an output of 200 units per day for the assembly line that has the elemental tasks shown in the table. Do the following:
a. Construct the precedence diagram.
b. Assign tasks according to the most following tasks rule. Break ties with the greatest positional weight rule.
c. Assign tasks according to the greatest positional weight rule. Break ties with the most following tasks rule.
d. Compute the balance delay for each rule. Which one yields the better set of assignments in this instance?
a)
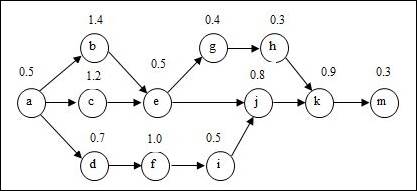
To draw: The precedence diagram.
Introduction:
Process selection:
It is the tactical choices made by a firm in picking the kind of production procedure to be followed in the process of production. The process is selected after reviewing many numbers of criteria and constraints.
Answer to Problem 8P
Precedence diagram:
Explanation of Solution
Given information:
| Task | Task time (Minutes) | Immediate predecessor |
| a | 0.5 | Nil |
| b | 1.4 | a |
| c | 1.2 | a |
| d | 0.7 | a |
| e | 0.5 | b, c |
| f | 1 | d |
| g | 0.4 | e |
| h | 0.3 | g |
| i | 0.5 | f |
| j | 0.8 | e, i |
| k | 0.9 | h, j |
| m | 0.3 | k |
Number of minutes per day = 400
Desired output per day = 200 units
Precedence diagram:
The precedence diagram is drawn circles and arrows. The tasks are represented in circles and weights for each task are represented outside the circle. The arrows are represented to show which task is preceding the other task and so on.
b)
To assign: Tasks on the basis of most following tasks.
Introduction:
Process selection:
It is the tactical choices made by a firm in picking the kind of production procedure to be followed in the process of production. The process is selected after reviewing many numbers of criteria and constraints.
Explanation of Solution
Given information:
| Task | Task time (Minutes) | Immediate predecessor |
| a | 0.5 | Nil |
| b | 1.4 | a |
| c | 1.2 | a |
| d | 0.7 | a |
| e | 0.5 | b, c |
| f | 1 | d |
| g | 0.4 | e |
| h | 0.3 | g |
| i | 0.5 | f |
| j | 0.8 | e, i |
| k | 0.9 | h, j |
| m | 0.3 | k |
Number of minutes per day = 400
Desired output per day = 200 units
Calculation of cycle time:
The cycle time is calculated by dividing the operating time per day by the desired output per day.
The number of following tasks, calculation of positional weight for each task is shown below.
| Task | Following tasks | Number of following tasks | Calculation of positional weight | Positional weight |
| a | b, c, d, e, f, g, h, i, j, k, m | 11 | 0.5 + 1.4 + 1.2 + 0.7 + 0.5 + 1 + 0.4 + 0.3 + 0.5 + 0.8 + 0.9 + 0.3 | 8.5 |
| b | e, g, h, j, k, m | 6 | 1.4 + 0.5 + 0.4 + 0.3 + 0.8 + 0.9 + 0.3 | 4.6 |
| c | e, g, h, j, k, m | 6 | 1.2 + 0.5 + 0.4 + 0.3 + 0.8 + 0.9 + 0.3 | 4.4 |
| d | f, i, j, k, m | 5 | 0.7 + 1 + 0.5 + 0.8 + 0.9 + 0.3 | 4.2 |
| e | g, h, j, k, m | 5 | 0.5 + 0.4 + 0.3 + 0.8+ 0.9 + 0.3 | 3.2 |
| f | i, j, k, m | 4 | 1 + 0.5 + 0.8 + 0.9 + 0.3 | 3.5 |
| g | h, k, m | 3 | 0.4 + 0.3 + 0.9 + 0.3 | 1.9 |
| h | k, m | 2 | 0.3 + 0.9 + 0.3 | 1.5 |
| i | j, k, m | 3 | 0.5 + 0.8 0.9 + 0.3 | 2.5 |
| j | k, m | 2 | 0.8 + 0.9 + 0.3 | 2 |
| k | m | 1 | 0.9 + 0.3 | 1.2 |
| m | Nil | 0 | 0.3 | 0.3 |
Assigning tasks to workstations:
| Workstation number | Eligible task | Assigned task | Task time | Unassigned cycle time | Reason |
| 2 | |||||
| 1 | a | a | 0.5 | 1.5 | Task 'a' is the only eligible task available |
| b, c, d | b | 1.4 | 0.1 | Task 'b' has the highest positional weight | |
| c, d | None | 0.1 (Idle time) | The task time is greater than the unassigned cycle time. | ||
| 2 | |||||
| 2 | c, d | c | 1.2 | 0.8 | Task 'c' has more following tasks |
| d, e | d | 0.7 | 0.1 | Task 'd' has the highest positional weight | |
| e, f | None | 0.1 (Idle time) | The task time is greater than the unassigned cycle time. | ||
| 2 | |||||
| 3 | e, f | e | 0.5 | 1.5 | Task 'e' has more following tasks |
| f, g | f | 1 | 0.5 | Task 'f' has more following tasks | |
| g, i | i | 0.5 | 0 | Task 'i' has the highest positional weight | |
| 2 | |||||
| 4 | g, j | g | 0.4 | 1.6 | Task 'g' has more following tasks |
| h, j | j | 0.8 | 0.8 | Task 'j' has the highest positional weight | |
| h | h | 0.3 | 0.5 | Task 'h' is the only eligible task available | |
| k | None | 0.5 (Idle time) | The task time is greater than the unassigned cycle time. | ||
| 2 | |||||
| 5 | k | k | 0.9 | 1.1 | Task 'k' is the only eligible task available |
| m | m | 0.3 | 0.8 | Task 'm' is the only task remaining | |
| 0.8 (Idle time) | All tasks completed |
Overview of tasks assignment:
| Workstation | Assigned tasks | Total cycle time used | Idle time |
| 1 | a, b | 1.9 | 0.1 |
| 2 | c, d | 1.9 | 0.1 |
| 3 | e, f, i | 2 | 0 |
| 4 | g, j, h | 1.5 | 0.5 |
| 5 | k, m | 1.2 | 0.8 |
c)
To assign: Tasks on the basis of greatest positional weight.
Introduction:
Process selection:
It is the tactical choices made by a firm in picking the kind of production procedure to be followed in the process of production. The process is selected after reviewing many numbers of criteria and constraints.
Explanation of Solution
Given information:
| Task | Task time (Minutes) | Immediate predecessor |
| a | 0.5 | Nil |
| b | 1.4 | a |
| c | 1.2 | a |
| d | 0.7 | a |
| e | 0.5 | b, c |
| f | 1 | d |
| g | 0.4 | e |
| h | 0.3 | g |
| i | 0.5 | f |
| j | 0.8 | e, i |
| k | 0.9 | h, j |
| m | 0.3 | k |
Number of minutes per day = 400
Desired output per day = 200 units
Calculation of cycle time:
The cycle time is calculated by dividing the operating time per day by the desired output per day.
The number of following tasks, calculation of positional weight for each task is shown below.
| Task | Following tasks | Number of following tasks | Calculation of positional weight | Positional weight |
| a | b, c, d, e, f, g, h, i, j, k, m | 11 | 0.5 + 1.4 + 1.2 + 0.7 + 0.5 + 1 + 0.4 + 0.3 + 0.5 + 0.8 + 0.9 + 0.3 | 8.5 |
| b | e, g, h, j, k, m | 6 | 1.4 + 0.5 + 0.4 + 0.3 + 0.8 + 0.9 + 0.3 | 4.6 |
| c | e, g, h, j, k, m | 6 | 1.2 + 0.5 + 0.4 + 0.3 + 0.8 + 0.9 + 0.3 | 4.4 |
| d | f, i, j, k, m | 5 | 0.7 + 1 + 0.5 + 0.8 + 0.9 + 0.3 | 4.2 |
| e | g, h, j, k, m | 5 | 0.5 + 0.4 + 0.3 + 0.8+ 0.9 + 0.3 | 3.2 |
| f | i, j, k, m | 4 | 1 + 0.5 + 0.8 + 0.9 + 0.3 | 3.5 |
| g | h, k, m | 3 | 0.4 + 0.3 + 0.9 + 0.3 | 1.9 |
| h | k, m | 2 | 0.3 + 0.9 + 0.3 | 1.5 |
| i | j, k, m | 3 | 0.5 + 0.8 0.9 + 0.3 | 2.5 |
| j | k, m | 2 | 0.8 + 0.9 + 0.3 | 2 |
| k | m | 1 | 0.9 + 0.3 | 1.2 |
| m | Nil | 0 | 0.3 | 0.3 |
Assigning tasks to workstations:
| Workstation number | Eligible task | Assigned task | Task time | Unassigned cycle time | Reason |
| 2 | |||||
| 1 | a | a | 0.5 | 1.5 | Task 'a' is the only eligible task available |
| b, c, d | b | 1.4 | 0.1 | Task 'b' has the highest positional weight | |
| c, d | None | 0.1 (Idle time) | The task time is greater than the unassigned cycle time. | ||
| 2 | |||||
| 2 | c, d | c | 1.2 | 0.8 | Task 'c' has the highest positional weight |
| d, e | d | 0.7 | 0.1 | Task 'd' has the highest positional weight | |
| e, f | None | 0.1 (Idle time) | The task time is greater than the unassigned cycle time. | ||
| 2 | |||||
| 3 | e, f | f | 1 | 1 | Task 'f' has the highest positional weight |
| e, i | e | 0.5 | 0.5 | Task 'e' has the highest positional weight | |
| g, i | i | 0.5 | 0 | Task 'g' has the highest positional weight | |
| 2 | |||||
| 4 | g, j | j | 0.8 | 1.2 | Task 'j' has the highest positional weight |
| g | g | 0.4 | 0.8 | Task 'g' is the only eligible task available | |
| h | h | 0.3 | 0.5 | Task 'h' is the only eligible task available | |
| k | None | 0.5 (Idle time) | The task time is greater than the unassigned cycle time. | ||
| 2 | |||||
| 5 | k | k | 0.9 | 1.1 | Task 'k' is the only eligible task available |
| m | m | 0.3 | 0.8 | Task 'm' is the only task remaining | |
| 0.8 (Idle time) | All tasks completed |
Overview of tasks assignment:
| Workstation | Assigned tasks | Total cycle time used | Idle time |
| 1 | a, b | 1.9 | 0.1 |
| 2 | c, d | 1.9 | 0.1 |
| 3 | f, e, i | 2 | 0 |
| 4 | j, g, h | 1.5 | 0.5 |
| 5 | k, m | 1.2 | 0.8 |
d)
To determine: The balance delay.
Introduction:
Process selection:
It is the tactical choices made by a firm in picking the kind of production procedure to be followed in the process of production. The process is selected after reviewing many numbers of criteria and constraints.
Answer to Problem 8P
Explanation of Solution
The balance delay is also known as the percentage of idle time.
Formula to calculate percentage of idle time:
Calculation of percentage of idle time:
Most following tasks:
The percentage of idle time is 15%.
Greatest positional weight:
The percentage of idle time is 15%.
The balance delay for most following tasks and greatest positional weight rule is 15%.
Want to see more full solutions like this?
Chapter 6 Solutions
EBK OPERATIONS MANAGEMENT


- Please show all steps and answers, thank you!arrow_forwardI am not sure if this is correct, because 8 cannot go directly to 10.arrow_forwardA practical application in real life to the Critical Path Method is the construction of a bridge with references, give a detailed essay on the stages involved in constructing a bridgearrow_forward
- Please assist in writing a complete reasearch project of the following title: Title of research: Study on the impact of Technology in the Work Place.arrow_forwardIntuition is both an emotional experience and a nonconscious analytic process. One problem, however, is that not all emotions signaling that there is a problem or opportunity represent intuition. Please in your Personal opinion how we would know if our “gut feelings” are intuition or not, and if not intuition, suggest what might be causing them.arrow_forwardA coworker suggests that the company where you both work would be much more effective if there were no organizational politics. Please in your personal and detailed opinion, What would you say to this person in reply?arrow_forward
- What is a bottleneck? Would you try to reduce a bottleneck? Why or why not? Please provide a referencearrow_forwardYour firm has been the auditor of Caribild Products, a listed company, for a number of years. The engagement partner has asked you to describe the matters you would consider when planning the audit for the year ended 31January 2022. During recent visit to the company you obtained the following information: (a) The management accounts for the 10 months to 30 November 2021 show a revenue of $260 million and profit before tax of $8 million. Assume sales and profits accrue evenly throughout the year. In the year ended 31 January 2021 Caribild Products had sales of $220 million and profit before tax of $16 million. (b) The company installed a new computerised inventory control system which has operated from 1 June 2021. As the inventory control system records inventory movements and current inventory quantities, the company is proposing: (i) To use the inventory quantities on the computer to value the inventory at the year-end (ii) Not to carry out an inventory count at the year-end (c)…arrow_forwardDevelop and implement a complex and scientific project for an organisation of your choice. please include report include the following: Introduction Background research to the project The 5 basic phases in the project management process Project Initiation Project Planning Project Execution Project Monitoring and Controlling Project Closing Conclusionarrow_forward
- Not use ai pleasearrow_forwardSam's Pet Hotel operates 51 weeks per year, 6 days per week, and uses a continuous review inventory system. It purchases kitty litter for $11.00 per bag. The following information is available about these bags: > Demand 95 bags/week > Order cost $52.00/order > Annual holding cost = 25 percent of cost > Desired cycle-service level = 80 percent >Lead time 4 weeks (24 working days) > Standard deviation of weekly demand = 15 bags > Current on-hand inventory is 320 bags, with no open orders or backorders. a. Suppose that the weekly demand forecast of 95 bags is incorrect and actual demand averages only 75 bags per week. How much higher will total costs be, owing to the distorted EOQ caused by this forecast error? The costs will be $ higher owing to the error in EOQ. (Enter your response rounded to two decimal places.)arrow_forwardSam's Pet Hotel operates 50 weeks per year, 6 days per week, and uses a continuous review inventory system. It purchases kitty litter for $10.50 per bag. The following information is available about these bags: > Demand = 95 bags/week > Order cost = $55.00/order > Annual holding cost = 35 percent of cost > Desired cycle-service level = 80 percent > Lead time = 4 weeks (24 working days) > Standard deviation of weekly demand = 15 bags > Current on-hand inventory is 320 bags, with no open orders or backorders. a. Suppose that the weekly demand forecast of 95 bags is incorrect and actual demand averages only 75 bags per week. How much higher will total costs be, owing to the distorted EOQ caused by this forecast error? The costs will be $ 10.64 higher owing to the error in EOQ. (Enter your response rounded to two decimal places.) b. Suppose that actual demand is 75 bags but that ordering costs are cut to only $13.00 by using the internet to automate order placing. However, the buyer does…arrow_forward
 Practical Management ScienceOperations ManagementISBN:9781337406659Author:WINSTON, Wayne L.Publisher:Cengage,
 MarketingMarketingISBN:9780357033791Author:Pride, William MPublisher:South Western Educational Publishing
 Purchasing and Supply Chain ManagementOperations ManagementISBN:9781285869681Author:Robert M. Monczka, Robert B. Handfield, Larry C. Giunipero, James L. PattersonPublisher:Cengage Learning