
Concept explainers
Videos
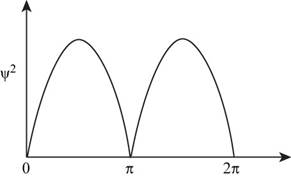
(a):
To determine:
Explanation:
Given The wave function for the electron in one dimensional system is,
The probability density curve for the function

Figure 1
(b)
Explanation:
Given The wave function for the electron in one dimensional system is,
The probability of finding electron for the given function is maximum on the values of
(c)
Explanation: The wave function for the electron in one dimensional system is,
The probability of finding electron for the given function is minimum on the values of
Conclusion:
(a) The probability density curve for the given function is as follows:
(b) The values of
(c) The probability of finding an electron at
Want to see the full answer?
Check out a sample textbook solution
Chapter 6 Solutions
LAB EXPERIMENTS FOR CHEM >C<


- Biological Macromolecules Naming and drawing the products of aldose oxidation and reduction aw a Fischer projection of the molecule that would produce L-ribonic acid if it were subjected to mildly oxidizing reaction conditions. Click and drag to start drawing a structure. X AP ‡ 1/5 Naor Explanation Check McGraw Hill LLC. All Rights Reserved. Terms of Use Privacy Center Accessibilarrow_forward● Biological Macromolecules Identifying the parts of a disaccharide Take a look at this molecule, and then answer the questions in the table below it. CH2OH O H H H OH OH OH H H CH2OH H O OH H OH H H H H OH Is this a reducing sugar? Does this molecule contain a glycosidic bond? If you said this molecule does contain a glycosidic bond, write the symbol describing it. If you said this molecule does contain a glycosidic bond, write the common names (including anomer and enantiomer labels) of the molecules that would be released if that bond were hydrolyzed. If there's more than one molecule, separate each name with a comma. Explanation Check O yes X O no ○ yes O no Uarrow_forwardThe aim of the lab is to measure the sodium content from tomato sauce using the Mohr titration method. There are two groups being: Regular Tomato sauce & Salt Reduced tomato sauce QUESTION: State how you would prepare both Regular & Salt reduced tomato sauce samples for chemical analysis using the Mohr titration methodarrow_forward
- Using the conditions of spontaneity to deduce the signs of AH and AS Use the observations about each chemical reaction in the table below to decide the sign (positive or negative) of the reaction enthalpy AH and reaction entropy AS. Note: if you have not been given enough information to decide a sign, select the "unknown" option. reaction observations conclusions A The reverse of this reaction is always spontaneous but proceeds faster at temperatures above -48. °C. ΔΗ is (pick one) ✓ AS is (pick one) B This reaction is spontaneous except below 114. °C but proceeds at a slower rate below 135. °C. ΔΗ is (pick one) AS is (pick one) ΔΗ is C This reaction is exothermic and proceeds faster at temperatures above -43. °C. (pick one) AS is (pick one) v Х 5 ? 18 Ararrow_forwardion. A student proposes the following Lewis structure for the perchlorate (CIO) io : :0: : Cl : - - : :0: ك Assign a formal charge to each atom in the student's Lewis structure. atom central O formal charge ☐ top O ☐ right O ☐ bottom O ☐ Cl ☐arrow_forwardDecide whether these proposed Lewis structures are reasonable. proposed Lewis structure Yes. Is the proposed Lewis structure reasonable? Cl- : 2: :Z: :Z: N—N : 0: C C1: O CO No, it has the wrong number of valence electrons. The correct number is: ☐ No, it has the right number of valence electrons but doesn't satisfy the octet rule. The symbols of the problem atoms are:* ☐ Yes. No, it has the wrong number of valence electrons. The correct number is: ☐ No, it has the right number of valence electrons but doesn't satisfy the octet rule. The symbols of the problem atoms are:* | Yes. No, it has the wrong number of valence electrons. The correct number is: No, it has the right number of valence electrons but doesn't satisfy the octet rule. The symbols of the problem atoms are:* | If two or more atoms of the same element don't satisfy the octet rule, just enter the chemical symbol as many times as necessary. For example, if two oxygen atoms don't satisfy the octet rule, enter "0,0". ☑arrow_forward
- Use the observations about each chemical reaction in the table below to decide the sign (positive or negative) of the reaction enthalpy AH and reaction entropy AS. Note: if you have not been given enough information to decide a sign, select the "unknown" option. reaction observations conclusions ΔΗ is (pick one) A This reaction is faster above 103. °C than below. AS is (pick one) ΔΗ is (pick one) B This reaction is spontaneous only above -9. °C. AS is (pick one) ΔΗ is (pick one) C The reverse of this reaction is always spontaneous. AS is (pick one) 18 Ararrow_forwardUse the observations about each chemical reaction in the table below to decide the sign (positive or negative) of the reaction enthalpy AH and reaction entropy AS. Note: if you have not been given enough information to decide a sign, select the "unknown" option. reaction observations conclusions A The reverse of this reaction is always spontaneous but proceeds slower at temperatures below 41. °C. ΔΗ is (pick one) AS is (pick one) ΔΗ is (pick one) B This reaction is spontaneous except above 94. °C. AS is (pick one) This reaction is always spontaneous, but ΔΗ is (pick one) C proceeds slower at temperatures below −14. °C. AS is (pick one) Х 00. 18 Ar 무ㅎ B 1 1arrow_forwardDraw the product of the reaction shown below. Ignore inorganic byproducts. + H CH3CH2OH HCI Drawingarrow_forward
- please explain this in simple termsarrow_forwardK Most Reactive Na (3 pts) Can the metal activity series (shown on the right) or a standard reduction potential table explain why potassium metal can be prepared from the reaction of molten KCI and Na metal but sodium metal is not prepared from the reaction of molten NaCl and K metal? Show how (not). Ca Mg Al с Zn Fe Sn Pb H Cu Ag Au Least Reactivearrow_forward(2 pts) Why is O2 more stable as a diatomic molecule than S2?arrow_forward
 ChemistryChemistryISBN:9781305957404Author:Steven S. Zumdahl, Susan A. Zumdahl, Donald J. DeCostePublisher:Cengage Learning
 ChemistryChemistryISBN:9781259911156Author:Raymond Chang Dr., Jason Overby ProfessorPublisher:McGraw-Hill Education
 Principles of Instrumental AnalysisChemistryISBN:9781305577213Author:Douglas A. Skoog, F. James Holler, Stanley R. CrouchPublisher:Cengage Learning
 Organic ChemistryChemistryISBN:9780078021558Author:Janice Gorzynski Smith Dr.Publisher:McGraw-Hill Education
 Chemistry: Principles and ReactionsChemistryISBN:9781305079373Author:William L. Masterton, Cecile N. HurleyPublisher:Cengage Learning
 Elementary Principles of Chemical Processes, Bind...ChemistryISBN:9781118431221Author:Richard M. Felder, Ronald W. Rousseau, Lisa G. BullardPublisher:WILEY