
Concept explainers
Videos
For the given set of tasks, do the following:
a. Develop the precedence diagram
b. Determine the minimum cycle time and then calculate the cycle time for a desired output of 500 units in a seven-hour day. Why might a manager use a cycle tune of 50 seconds?
c. Determine the minimum number of workstations for output of 500 units per day
d. Balance the line using the greatest positional weight heuristic. Break ties with the most following tasks heuristic. Use a cycle tune of 50 seconds.
e. Calculate the percentage idle time for the line.
a)
To draw: The precedence diagram.
Introduction:
Process selection:
It is the tactical choices made by a firm in picking the kind of production procedure to be followed in the process of production. The process is selected after reviewing many numbers of criteria and constraints.
Answer to Problem 7P
Precedence diagram:
Explanation of Solution
Given information:
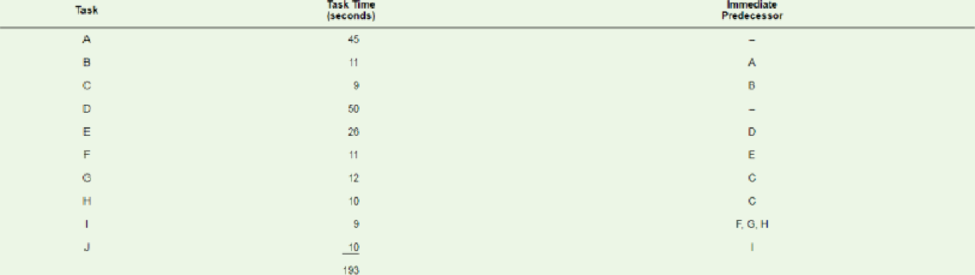
| Task | Task time (seconds) | Immediate predecessor |
| A | 45 | Nil |
| B | 11 | A |
| C | 9 | B |
| D | 50 | Nil |
| E | 26 | D |
| F | 11 | E |
| G | 12 | C |
| H | 10 | C |
| I | 9 | F, G , H |
| J | 10 | I |
| Total | 193 |
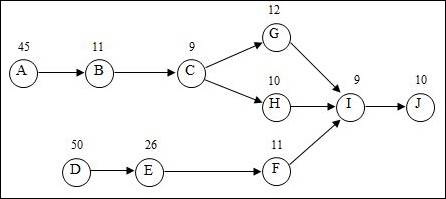
Precedence diagram:
The precedence diagram is drawn circles and arrows. The tasks are represented in circles and weights for each task are represented outside the circle. The arrows are represented to show which task is preceding the other task and so on.
b)
To determine: The minimum cycle time and the cycle time for the desired output.
Introduction:
Process selection:
It is the tactical choices made by a firm in picking the kind of production procedure to be followed in the process of production. The process is selected after reviewing many numbers of criteria and constraints.
Answer to Problem 7P
Explanation of Solution
Given information:
| Task | Task time (seconds) | Immediate predecessor |
| A | 45 | Nil |
| B | 11 | A |
| C | 9 | B |
| D | 50 | Nil |
| E | 26 | D |
| F | 11 | E |
| G | 12 | C |
| H | 10 | C |
| I | 9 | F, G , H |
| J | 10 | I |
| Total | 193 |
Operating hours per day = 7
Sum of all task times = 193 seconds
Desired output per day = 500
Calculation of minimum cycle time:
The minimum cycle time is equal to the time of the longest task.
The minimum cycle time is 50 seconds / unit.
Calculation of cycle time for the desired output:
The cycle time is calculated by dividing the operating time per day in seconds by the desired output per day.
The cycle time for the desired output is 50.4 seconds / unit.
The manager might use a cycle time of 50 seconds because it is closer to the calculated time. Also the task times are integers giving it a good chance to balance the line effectively.
c)
To determine: The minimum number of workstations for the desired output.
Introduction:
Process selection:
It is the tactical choices made by a firm in picking the kind of production procedure to be followed in the process of production. The process is selected after reviewing many numbers of criteria and constraints.
Answer to Problem 7P
Explanation of Solution
Given information:
| Task | Task time (seconds) | Immediate predecessor |
| A | 45 | Nil |
| B | 11 | A |
| C | 9 | B |
| D | 50 | Nil |
| E | 26 | D |
| F | 11 | E |
| G | 12 | C |
| H | 10 | C |
| I | 9 | F, G , H |
| J | 10 | I |
| Total | 193 |
Operating hours per day = 7
Sum of all task times = 193 seconds
Desired output per day = 500
Calculation of minimum number of workstations:
The minimum number of workstations is calculated by dividing the sum of all task times with the calculated cycle time.
The minimum number of workstations for the desired output is 4 workstations.
d)
To assign: Tasks on the basis of greatest positional weight.
Introduction:
Process selection:
It is the tactical choices made by a firm in picking the kind of production procedure to be followed in the process of production. The process is selected after reviewing many numbers of criteria and constraints.
Explanation of Solution
Given information:
| Task | Duration (minutes) | Immediate (Predecessor) |
| a | 0.1 | Nil |
| b | 0.2 | a |
| c | 0.9 | b |
| d | 0.6 | c |
| e | 0.1 | Nil |
| f | 0.2 | d, e |
| g | 0.4 | f |
| h | 0.1 | g |
| i | 0.2 | h |
| j | 0.7 | i |
| k | 0.3 | j |
| l | 0.2 | k |
Cycle time = 50 seconds
The number of following tasks, calculation of positional weight for each task is shown below.
| Task | Following tasks | Number of following tasks | Calculation of positional weight | Positional weight |
| A | B, C, G, H, I, J | 6 | 45 + 11 + 9 + 12 + 10 + 9 + 10 | 106 |
| B | C, G, H, I, J | 5 | 11 + 9 + 12 + 10 + 9 + 10 | 61 |
| C | G, H, I, J | 4 | 9 + 12 + 10 + 9 + 10 | 50 |
| D | E, F, I, J | 4 | 50 + 26 + 11 + 9 + 10 | 106 |
| E | F, I, J | 3 | 26 + 11 + 9 + 10 | 56 |
| F | I, J | 2 | 11 + 9 + 10 | 30 |
| G | I, J | 2 | 12 + 9 + 10 | 31 |
| H | I, J | 2 | 10 + 9 + 10 | 29 |
| I | J | 1 | 9 + 10 | 19 |
| J | Nil | 0 | 10 | 10 |
Assigning tasks to workstations:
| Workstation number | Eligible task | Assigned task | Task time | Unassigned cycle time | Reason |
| 50 | |||||
| 1 | A, D | A | 45 | 5 | Task 'A' has more following tasks |
| B, D | None | 5 (Idle time) | The task time is greater than the unassigned cycle time. | ||
| 50 | |||||
| 2 | B, D | D | 50 | 0 | Task 'D' has the highest positional weight |
| 50 | |||||
| 3 | B, E | B | 11 | 39 | Task 'B' has the highest positional weight |
| C, E | E | 26 | 13 | Task 'E' has the highest positional weight | |
| C, F | C | 9 | 4 | Task 'C' has the highest positional weight | |
| F, G, H | None | 4 (Idle time) | The task time is greater than the unassigned cycle time. | ||
| 50 | |||||
| 4 | F, G, H | G | 12 | 38 | Task 'G' has the highest positional weight |
| F, H | F | 11 | 27 | Task 'F' has the highest positional weight | |
| H | H | 10 | 17 | Task 'H' is the only eligible task available | |
| I | I | 9 | 8 | Task 'I' is the only eligible task available | |
| J | None | 8 (Idle time) | The task time is greater than the unassigned cycle time. | ||
| 50 | |||||
| 5 | J | J | 10 | 40 | Task 'J' is the only task remaining |
| 40 (Idle time) | All tasks completed |
Overview of tasks assignment:
| Workstation | Assigned tasks | Total cycle time used | Idle time |
| 1 | A | 45 | 5 |
| 2 | D | 50 | 0 |
| 3 | B, E, C | 46 | 4 |
| 4 | G, F, H, I | 42 | 8 |
| 5 | J | 10 | 40 |
e)
To determine: The percentage of idle time.
Introduction:
Process selection:
It is the tactical choices made by a firm in picking the kind of production procedure to be followed in the process of production. The process is selected after reviewing many numbers of criteria and constraints.
Answer to Problem 7P
Explanation of Solution
Formula to calculate percentage of idle time:
Calculation of percentage of idle time:
The percentage of idle time is 22.80%.
Want to see more full solutions like this?
Chapter 6 Solutions
Operations Management (McGraw-Hill Series in Operations and Decision Sciences)


- discuss team development stagesarrow_forwardLearning Activity 6: Canadian Business This Year Read the following webpage: The Business Development Bank of Canada. (2023). Canadian economic outlook for 2024: Shifting into neutral. https://www.bdc.ca/en/articles- tools/blog/canadian-economic-outlook-for-2024- shifting-into-neutral "Despite persistently high inflation and rising. interest rates, the news was generally better than expected for the Canadian economy in 2023" (BDC Blog 2024). Discussion Question: In your view, what are the most pressing problems for Canadian companies or consumers in 2024? Explain your answer using current examples of companies or consumer concerns.arrow_forwardTravelling and working internationally can lead to a life of adventure and unique career experiences. For businesses, selecting the right candidates to take on foreign assignments can propel, delay, or deny the success of the international ventures. As an international manager, identify key competencies you would look for in choosing expatriates. What might be some of their concerns in taking on overseas assignments? What are some best practices in supporting expats during and after their assignments?arrow_forward
- Research proposal: The Investigation of Career Development and Job satisfaction atEskom Rotek Industries 1. Introduction (250 words) 2. Research Context: Background (Research Context: Background (250 words) 3. The Research Problem (The Research Problem) 4. Aim of the study (Maximum 50 words) 5. Research Objectives (3 in total) 6. Research Questions (3 in total) 7. Justification or rationale of the study (150 words) 8. Literature Review (2-3 pages / 1000-1500 words) 9. Research Design and Methodology (1 - 2 page in total, from 9.1 to 9.6) 9.1 Research Philosophy 9.2 Research Methodology 9.3 Target Population and Sampling strategy 9.4 Data Collection 9.5 Data Analysis (100 words) 9.6 Pilot Study 10. Ethical considerations 11. Referencearrow_forwardWith your experience and research, discuss;(a) what type of “Leadership Style” is used in communications services (Digicel Group Limited)?(b) whether the style used is successful or not and why. Justify your position with relevant citation and references ( Rubic is attached to guide the essay ) NOTE: NO AI RESPONSES PLEASEarrow_forwardby the end of 2013, the IPL port was operational and the naphtha was flowing to the Himachal Fertilizer Corporation (HFC) plant in Central India after being granted the port contract in Summer 2012. The plant was located in an industrial area that had several pipelines in the general geographic area including a crude oil pipeline leading to a refinery, and a pipeline carrying pesticides to be processed and redistributed to local farms in the area. In July 2014, Ajay Patel, the logistics general manager received notification that there were some minor leaks along the pipeline that were being fixed. Workers in the area had experienced sudden headaches and lightheadedness and the company immediately moved to investigate the leak and address faulty seams that had eroded and weakened. The flow of naphtha was temporarily stopped for 72 hours so two portions of the pipeline could be removed, and the eroded portions replaced. Patel put enormous pressure on the repair team to get the repair…arrow_forward
- in the MABE: learning to be multinational case report, what is the reccomended course of action?arrow_forwardIn the MABE case report what would be the reccomened course of action?arrow_forwardQuestion 6. An electrical engineering company is designing two types of solar panel systems: Standard Panels (S) and High-Efficiency Panels (H). The company has certain constraints regarding the hours of labor and material available for production each week. Each Standard Panel requires 4 hours of labor and 2 units of material and each High-Efficiency Panel requires 3 hours of labor and 5 units of material. The company has a maximum of 60 hours of labor and 40 units of material available per week. The profit from each Standard Panel is GH¢80, and the profit from each High-Efficiency Panel is GH¢100. The company wants to determine how many of each type of panel to produce in order to maximize profit. i) Solve this LPP by using graphical analysis ii) What will be the slack at the optimal solution point? Show calculation.arrow_forward
- qusestion 6. An electrical engineering company is designing two types of solar panel systems: Standard Panels (S) and High-Efficiency Panels (H). The company has certain constraints regarding the hours of labor and material available for production each week. Each Standard Panel requires 4 hours of labor and 2 units of material and each High-Efficiency Panel requires 3 hours of labor and 5 units of material. The company has a maximum of 60 hours of labor and 40 units of material available per week. The profit from each Standard Panel is GH¢80, and the profit from each High-Efficiency Panel is GH¢100. The company wants to determine how many of each type of panel to produce in order to maximize profit. i. Formulate a linear programming model of the problem for the company. ii Convert the linear programming model formulated in (a) to a standard form.arrow_forwardG ווח >>> Mind Tap Cengage Learning 1- CENGAGE MINDTAP Chapter 09 Excel Activity: Exponential Smoothing Question 1 3.33/10 e Submit 自 A ng.cengage.com C Excel Online Student Work G A retail store records customer demand during each sales period. 1. What is the f... Q Search this course ? ✓ Co Excel Online Tutorial Excel Online Activity: Exponential Smoothing A-Z A retail store records customer demand during each sales period. The data has been collected in the Microsoft Excel Online file below. Use the Microsoft Excel Online file below to develop the single exponential smoothing forecast and answer the following questions. Office Video X Open spreadsheet Questions 1. What is the forecast for the 13th period based on the single exponential smoothing? Round your answer to two decimal places. 25.10 2. What is the MSE for the single exponential smoothing forecast? Round your answer to two decimal places. 21.88 Activity Frame ? 3. Choose the correct graph for the single exponential…arrow_forwardNot use ai pleasearrow_forward
 Practical Management ScienceOperations ManagementISBN:9781337406659Author:WINSTON, Wayne L.Publisher:Cengage,
 Purchasing and Supply Chain ManagementOperations ManagementISBN:9781285869681Author:Robert M. Monczka, Robert B. Handfield, Larry C. Giunipero, James L. PattersonPublisher:Cengage Learning
 Management, Loose-Leaf VersionManagementISBN:9781305969308Author:Richard L. DaftPublisher:South-Western College PubMarketingMarketingISBN:9780357033791Author:Pride, William MPublisher:South Western Educational Publishing