LogixPro PLC Lab Manual for Programmable Logic Controllers
5th Edition
ISBN: 9781259680847
Author: Frank D. Petruzella
Publisher: McGraw-Hill Education
expand_more
expand_more
format_list_bulleted
Textbook Question
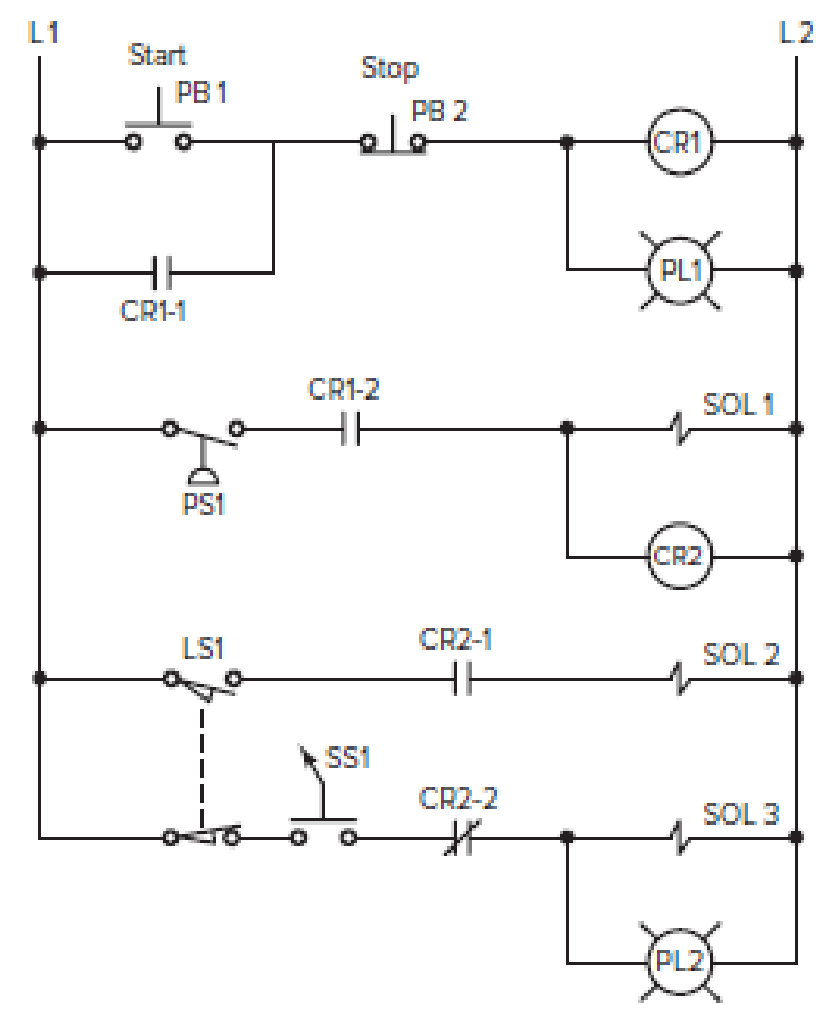
Chapter 6, Problem 5P
Design a PLC
Assume: PB1 pushbutton used is an NO type.
PB2 pushbutton used is an NC type.
PS1 pressure switch used is an NO type.
LS1 limit switch used has only one set of NC contacts.
Expert Solution & Answer
Want to see the full answer?
Check out a sample textbook solution
Students have asked these similar questions
Dijkstra's Algorithm (part 1). Consider the network shown below, and Dijkstra’s link-state algorithm. Here, we are interested in computing the least cost path from node E (note: the start node here is E) to all other nodes using Dijkstra's algorithm. Using the algorithm statement used in the textbook and its visual representation, complete the "Step 0" row in the table below showing the link state algorithm’s execution by matching the table entries (i), (ii), (iii), and (iv) with their values. Write down your final [correct] answer, as you‘ll need it for the next question.
4. |z + 5 - 5i| = 7
14.
dz,
C: |z❘
C: |z❘ = 0.6
ze² - 2iz
H
Chapter 6 Solutions
LogixPro PLC Lab Manual for Programmable Logic Controllers
Ch. 6 - Prob. 1RQCh. 6 - Prob. 2RQCh. 6 - Prob. 3RQCh. 6 - Prob. 4RQCh. 6 - Prob. 5RQCh. 6 - Prob. 6RQCh. 6 - Prob. 7RQCh. 6 - Prob. 8RQCh. 6 - What do the abbreviations NO and NC represent when...Ch. 6 - Prob. 10RQ
Ch. 6 - Prob. 11RQCh. 6 - Prob. 12RQCh. 6 - Compare the operation of a photovoltaic solar cell...Ch. 6 - What are the two basic components of a...Ch. 6 - Prob. 15RQCh. 6 - Give an explanation of how a scanner and a decoder...Ch. 6 - Prob. 17RQCh. 6 - Prob. 18RQCh. 6 - Prob. 19RQCh. 6 - Prob. 20RQCh. 6 - Prob. 21RQCh. 6 - Prob. 22RQCh. 6 - Prob. 23RQCh. 6 - Prob. 24RQCh. 6 - Prob. 25RQCh. 6 - Prob. 26RQCh. 6 - Prob. 27RQCh. 6 - Prob. 28RQCh. 6 - Prob. 29RQCh. 6 - Prob. 30RQCh. 6 - Prob. 31RQCh. 6 - Prob. 32RQCh. 6 - Prob. 33RQCh. 6 - Prob. 1PCh. 6 - Prob. 2PCh. 6 - Prob. 3PCh. 6 - Prob. 4PCh. 6 - Design a PLC program and prepare a typical I/O...Ch. 6 - Prob. 6PCh. 6 - Prob. 7PCh. 6 - Prob. 8P
Additional Engineering Textbook Solutions
Find more solutions based on key concepts
1.2 Explain the difference between geodetic and plane
surveys,
Elementary Surveying: An Introduction To Geomatics (15th Edition)
The solid steel shaft AC has a diameter of 25 mm and is supported by smooth bearings at D and E. It is coupled ...
Mechanics of Materials (10th Edition)
Why is the study of database technology important?
Database Concepts (8th Edition)
This optional Google account security feature sends you a message with a code that you must enter, in addition ...
SURVEY OF OPERATING SYSTEMS
Assume a telephone signal travels through a cable at two-thirds the speed of light. How long does it take the s...
Electric Circuits. (11th Edition)
17–1C A high-speed aircraft is cruising in still air. How does the temperature of air at the nose of the aircra...
Thermodynamics: An Engineering Approach
Knowledge Booster

Similar questions
arrow_back_ios
SEE MORE QUESTIONS
arrow_forward_ios
Recommended textbooks for you
 Systems ArchitectureComputer ScienceISBN:9781305080195Author:Stephen D. BurdPublisher:Cengage Learning
 Principles of Information Systems (MindTap Course...Computer ScienceISBN:9781305971776Author:Ralph Stair, George ReynoldsPublisher:Cengage Learning
 Operations Research : Applications and AlgorithmsComputer ScienceISBN:9780534380588Author:Wayne L. WinstonPublisher:Brooks Cole
 C++ for Engineers and ScientistsComputer ScienceISBN:9781133187844Author:Bronson, Gary J.Publisher:Course Technology Ptr
 Programming Logic & Design ComprehensiveComputer ScienceISBN:9781337669405Author:FARRELLPublisher:Cengage
 Fundamentals of Information SystemsComputer ScienceISBN:9781305082168Author:Ralph Stair, George ReynoldsPublisher:Cengage Learning
Systems Architecture
Computer Science
ISBN:9781305080195
Author:Stephen D. Burd
Publisher:Cengage Learning
Principles of Information Systems (MindTap Course...
Computer Science
ISBN:9781305971776
Author:Ralph Stair, George Reynolds
Publisher:Cengage Learning
Operations Research : Applications and Algorithms
Computer Science
ISBN:9780534380588
Author:Wayne L. Winston
Publisher:Brooks Cole
C++ for Engineers and Scientists
Computer Science
ISBN:9781133187844
Author:Bronson, Gary J.
Publisher:Course Technology Ptr
Programming Logic & Design Comprehensive
Computer Science
ISBN:9781337669405
Author:FARRELL
Publisher:Cengage
Fundamentals of Information Systems
Computer Science
ISBN:9781305082168
Author:Ralph Stair, George Reynolds
Publisher:Cengage Learning