
PRINCIPLES OF MACROECONOMICS
2nd Edition
ISBN: 9780357129128
Author: OpenStax
Publisher: CENGAGE L
expand_more
expand_more
format_list_bulleted
Textbook Question
Chapter 6, Problem 29P
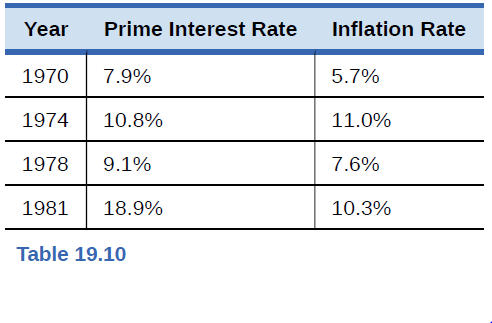
The “prime” interest rate is the rate that banks charge their best customers. Based on the nominal interest rates and inflation rates in Table 19.10, in which of the years would it have been best to be a lender? Based on the nominal interest rates and inflation rates in Table 19.10, in which of the years given would it have been best to be a borrower?
Expert Solution & Answer

Trending nowThis is a popular solution!

Students have asked these similar questions
What bill are they currently sponsoring? Please provide the answer to the question using www.akleg.gov for Senate Bill 30?
Do they have any specified areas of interest( examples: oil/gas, education, subsistence). Please provide the answer to the question using www.akleg.gov for Senate Bill 30?
A brief synopsis of whether you believe they represent your interest, why or why not? Please provide the answer to this question by using www.akleg for senate bill 30 ?
Chapter 6 Solutions
PRINCIPLES OF MACROECONOMICS
Ch. 6 - Country A has export sales of 20 billion,...Ch. 6 - Which of the following are included in GDP, and...Ch. 6 - Using data from Table 19.5 how much of the nominal...Ch. 6 - Without looking at Table 19.7, return to Figure...Ch. 6 - According to Table 19.7, how often have recessions...Ch. 6 - According to Table 19.7, how long has the average...Ch. 6 - According to Table 19.7, how long has the average...Ch. 6 - Is it possible for GDP to rise while at the same...Ch. 6 - The Central African Republic has a GDP of...Ch. 6 - Explain briefly whether each of the following...
Ch. 6 - What are the main components of measuring GDP with...Ch. 6 - What are the main components of measuring GDP with...Ch. 6 - Would you usually expect GDP as measured by what...Ch. 6 - Why must you avoid double counting when measuring...Ch. 6 - What is the difference between a series of...Ch. 6 - How do you convert a series of nominal economic...Ch. 6 - What are typical GDP patterns for a high-income...Ch. 6 - What are the two main difficulties that arise in...Ch. 6 - List some of the reasons why economists should not...Ch. 6 - U.S. macroeconomic data are among the best in the...Ch. 6 - What does GDP not tell us about the economy?Ch. 6 - Should people typically pay more attention to...Ch. 6 - Why do you suppose that U.S. GDP is so much higher...Ch. 6 - Why do you think that GDP does not grow at a...Ch. 6 - Cross country comparisons of GDP per capita...Ch. 6 - Why might per capita GDP be only an imperfect...Ch. 6 - How might you measure a green GDP?Ch. 6 - Last year, a small nation with abundant forests...Ch. 6 - The prime interest rate is the rate that banks...Ch. 6 - A mortgage 105m is a loan that a person makes to...Ch. 6 - Ethiopia has a GDP of 8 billion (measured in U.S....Ch. 6 - In 1980, Denmark had a GDP of 70 billion (measured...Ch. 6 - The Czech Republic has 3 GDP of 1,800 billion...
Additional Business Textbook Solutions
Find more solutions based on key concepts
The exchange rate, potential risk, transfer pricing, tax law differences and strategies are the items affects t...
Gitman: Principl Manageri Finance_15 (15th Edition) (What's New in Finance)
4. JC Manufacturing purchase d inventory for $ 5,300 and al so paid a $260 freight bill. JC Manufacturing retur...
Horngren's Financial & Managerial Accounting, The Financial Chapters (Book & Access Card)
E6-14 Using accounting vocabulary
Learning Objective 1, 2
Match the accounting terms with the corresponding d...
Horngren's Accounting (12th Edition)
Why is the capital-budgeting process so important?
Foundations Of Finance
Discussion Questions 1. What characteristics of the product or manufacturing process would lead a company to us...
Managerial Accounting (5th Edition)
An experimental composite engine block for an automobile will trim 20 pounds of weight compared with a traditio...
Engineering Economy (17th Edition)
Knowledge Booster

Similar questions
- What is their background (degree, career/job, community of origin, anything else you choose to include) Please provide the answers using www.akleg.gov for Senate Bill 30?arrow_forwardPlease provide the answer to these questions using informatioin from www.akleg.gov for Senate bill 30. What is their party affiliation?arrow_forwardPlease provide the answer to the question using information from www.akleg.gov for Senate Bill 30. How lonng have they been in public office?arrow_forward
- Please provide the answer to the following questions using www.akleg.gov website for Senate Bill 30. What District do they represent?arrow_forwardPlease provide the answer to this question using www.akleg.gov for Senate Bill 30? Do they hold any committe seats?arrow_forwardWhat impact does the North American Free Trade Agreement have on relations between countries in North America? NAFTA regulates and enforces protections for workers to ensure that they have safe working environments and fair wages. NAFTA eliminates tariffs and trade restrictions, facilitating export and import between countries in North America. NAFTA sets up regulations limiting industrial pollution in all three countries, ensuring the costs of manufacturing are similar in each country. NAFTA eliminates trade restrictions on products from embargoed countries.arrow_forward
- Which of the following is included in the GDP_________? Group of answer choices The two answers describe components of the GDP. The federal government expenditure on welfare payments. Households goods and services produced at home. Neither of the two answers describe components of the GDP.arrow_forwardWhat are two examples of where historical cost is used within the financial statements. State both the account name and the amount for each account selected. What was the amount of revenue that Airbnb reported for 2024? Did the revenue grow over the prior year of 2023? What was the dollar and the percentage increase or decrease?arrow_forwardWhat was the amount of revenue that Airbnb reported for 2024? Did the revenue grow over the prior year of 2023? What was the dollar and the percentage increase or decrease? What was the amount of net income or net loss that Airbnb reported for the year of 2024? Did the net income increase or decrease versus the prior year of 2023? What was the dollar and the percentage increase or decrease?arrow_forward
- Who are the Airbnb's independent auditors and what is the role of these auditors? What opinion do the Airbnb independent auditors express regarding the financial statements and what does this opinion mean to an investor?arrow_forwardDoes Airbnb's fiscal year-end coincide with a calendar year-end? What products and/or services does Airbnb sell? Please be detailed. What major industry does Airbnb operate in? name at least two competitors. What are two risks identified by Airbnb management? Describe these risks.arrow_forwardSolve please and thanks!arrow_forward
arrow_back_ios
SEE MORE QUESTIONS
arrow_forward_ios
Recommended textbooks for you
 Economics (MindTap Course List)EconomicsISBN:9781337617383Author:Roger A. ArnoldPublisher:Cengage Learning


Economics (MindTap Course List)
Economics
ISBN:9781337617383
Author:Roger A. Arnold
Publisher:Cengage Learning