Foundations of Finance (9th Edition) (Pearson Series in Finance)
9th Edition
ISBN: 9780134083285
Author: Arthur J. Keown, John D. Martin, J. William Petty
Publisher: PEARSON
expand_more
expand_more
format_list_bulleted
Concept explainers
Videos
Textbook Question
Chapter 6, Problem 23SP
(Portfolio beta and security market line) You own a portfolio consisting of the stocks below:
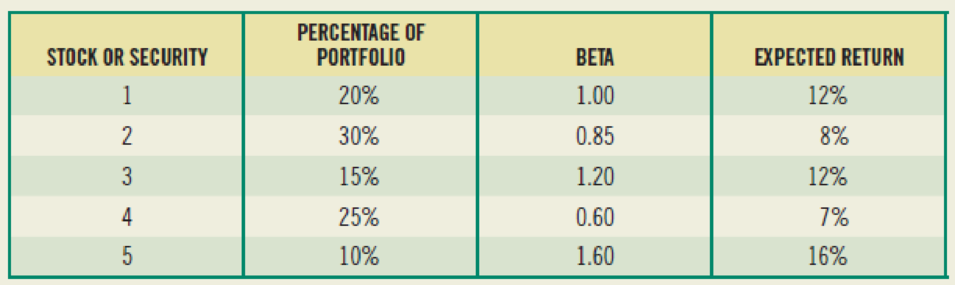
The risk-free rate is 3 percent. Also, the expected return on the market portfolio is 11 percent.
- a. Calculate the expected return of your portfolio. (Hint: The expected return of a portfolio equals the weighted average of the individual stocks’ expected returns, where the weights are the percentage invested in each stock.)
- b. Calculate the portfolio beta.
- c. Given the foregoing information, plot the security market line on paper. Plot the stocks from your portfolio on your graph.
- d. From your plot in part (c), which stocks appear to be your winners and which ones appear to be your losers?
- e. Why should you consider your conclusion in part (d) to be less than certain?
Expert Solution & Answer
Want to see the full answer?
Check out a sample textbook solution
Students have asked these similar questions
Brightwoodę Furniture provides the following financial data for a
given enod:
Sales
Aount ($) Per Unit ($)
150,000
13
Less Variable E
-
L96,000
13
Contribwaon Margin c
1C
Less Fixed Expenses
$5,000
et Income
125,000
a. What is the company's CM ratio?
b. If quarterly sales increase by $5,200 and there is no change in fixed
expenses, by how much would you expect quarterly net operating
income to increase?
Please give correct answer dont use chatgpt .
if image is blurr or any data is unclear then please comment i will write values , dont give answer without sure that data in image is showing properly.
Footfall Manufacturing Ltd. reports
information at the end of the current year:
Net Sales
$100,000
Debtor's turnover ratio (based on 2
net sales)
Inventory turnover ratio
1.25
Fixed assets turnover ratio
0.8
Debt to assets ratio
0.6
Net profit margin
5%
Gross profit margin
25%
Return on investment
2%
the
following financial
Use the given information to fill out the templates for income
statement and balance sheet given below:
Income Statement of Footfall Manufacturing Ltd. for the year ending
December 31, 20XX
(in $)
Sales
100,000
Cost of goods
sold
Gross profit
Other expenses
Earnings before
Lax
Tax @50%
Earnings
tax
after
Chapter 6 Solutions
Foundations of Finance (9th Edition) (Pearson Series in Finance)
Ch. 6 - a. What is meant by the investors required rate of...Ch. 6 - Prob. 2RQCh. 6 - What is a beta? How is it used to calculate r, the...Ch. 6 - Prob. 4RQCh. 6 - Prob. 5RQCh. 6 - Prob. 6RQCh. 6 - Prob. 7RQCh. 6 - What effect will diversifying your portfolio have...Ch. 6 - (Expected return and risk) Universal Corporation...Ch. 6 - (Average expected return and risk) Given the...
Ch. 6 - (Expected rate of return and risk) Carter, Inc. is...Ch. 6 - (Expected rate of return and risk) Summerville,...Ch. 6 - Prob. 5SPCh. 6 - Prob. 9SPCh. 6 - Prob. 10SPCh. 6 - Prob. 11SPCh. 6 - Prob. 12SPCh. 6 - (Capital asset pricing model) Using the CAPM,...Ch. 6 - Prob. 16SPCh. 6 - Prob. 17SPCh. 6 - a. Compute an appropriate rate of return for Intel...Ch. 6 - (Estimating beta) From the graph in the right...Ch. 6 - Prob. 20SPCh. 6 - Prob. 21SPCh. 6 - (Capital asset pricing model) The expected return...Ch. 6 - (Portfolio beta and security market line) You own...Ch. 6 - (Portfolio beta) Assume you have the following...Ch. 6 - Prob. 1MCCh. 6 - Prob. 2MCCh. 6 - Prob. 3MCCh. 6 - Prob. 4MCCh. 6 - Prob. 5MCCh. 6 - Prob. 6MCCh. 6 - Prob. 7MCCh. 6 - Prob. 8MCCh. 6 - Prob. 9MCCh. 6 - Prob. 10MCCh. 6 - Prob. 11MC
Knowledge Booster


Learn more about
Need a deep-dive on the concept behind this application? Look no further. Learn more about this topic, finance and related others by exploring similar questions and additional content below.Similar questions
- if image is blurr or data is not clear in image please comment i will write data or upload new image. Don't use chatgpt. confirm i will give unhelpful if answer with using incorrect data .arrow_forwardBright wood Seating sells reclining chairs for $55.00 per unit. The variable cost is 322 per unit. Each reclining chair requires 5 direct labor hours and 3 machine hours to produce. atribution margin pegmachine home* Wrightwood Manufacturing has a break-even point of 1,500 units. The sales price per unit is $18, and the variable cost per u 13. If the company sells 3,500 units, what will its net income be? Creatwood Industries provides the following budget data for its Processing Department for the year 2022: ⚫ Manufacturing Overhead Costs=$250,400 . Direct Labor Costs $1,234,500 Determine the manufacturing overhead application rate underthe base of Direct Labor Costs. Modesto Accessories manufactures two types of wallets leather and canvas. The company allocates manufacturing overhead using a single plant wide rate with direct labor cost as the allocation base. $48 Estimated Overhead Costs = 30,600 Direct Labor Cost per Leather Wallet Direct Labor Cost per Canvas Wallet = $52 Number of…arrow_forwardPlease don't use AI . Chatgpt giving wrong answer . confirm i will give unhelpharrow_forward
- Anti-Pandemic Pharma Co. Ltd. reports the following information inits income statement:Sales = $5,250,000;Costs = $2, 173,000;Other expenses = $187,400;Depreciation expense = $79,000;Interest expense= $53,555;Taxes = $76,000;Dividends = $69,000.$136,700 worth of new shares were also issued during the year andlong-term debt worth $65,300 was redeemed.a) Compute the cash flow from assetsb) Compute the net change in working capital Show all calculations. Please no spreadsheet so that I can clearly understandarrow_forwardAnswer this question Using the Google drive liink below it hhas the case study In the scenario, Sharp’s employer has been putting more emphasis on controlling costsfor the various businesses. With the slowing of overall spending in the construction sector,Travolta had ordered managers to closely monitor expenses. He had sold several companiesand has given vice presidents greater responsibility for statements of financial positions. Whatpositive and negative consequences might this pose to the company in future fraud prevention?Outline at least three of each type. Please use sources and insert intext citiations Apa 7 format in the answer and provide the links and references below. https://docs.google.com/document/d/1MpthrFl3eAnMKR-EprYRP9sMo8Ll0WtbhxhpGtLbdcw/edit?usp=sharingarrow_forwardfile:///C:/Users/rafan/Downloads/Assignment%201%20Paving%20Company%20Case%20S2%202024%20to%202025.pdf Using the link for the fraud case answer only this question below. b) As discussed in units 1 to 4, all frauds involve key elements. Identify and describe usingexamples, the elements of Sharp’s fraud.arrow_forward
- Option should be match experts are giving incorrect answer they are using AI /Chatgpt that is generating wrong answer. i will give unhelpful if answer will not match in option. dont use AI alsoarrow_forwardOption should be match. please don't use ai if option will not match means answer is incorrect . Ai giving incorrect answerarrow_forwardOption should be match. please don't use ai if option will not match means answer is incorrect . Ai giving incorrect answerarrow_forward
- all frauds involve key elements. Identify and describe usingexamples the elements of fraudarrow_forwardSolve for maturity value, discount period, bank discount, and proceeds. Assume a bank discount rate of 9%. Use the ordinary interest method. (Use Days in a year table.) Note: Do not round intermediate calculations. Round your final answers to the nearest cent. face value(principal) $50000rate interest:11%length of note: 95 days maturity value: ?date of note: june 10date note discounted: July 18discount period:?bank discount:?proceeds:?arrow_forwardWhat are the different types of audits and different types of auditors? WHat is an example of each type of audit? What is the significance of each from the perspective of different stakeholders?arrow_forward
arrow_back_ios
SEE MORE QUESTIONS
arrow_forward_ios
Recommended textbooks for you
 EBK CONTEMPORARY FINANCIAL MANAGEMENTFinanceISBN:9781337514835Author:MOYERPublisher:CENGAGE LEARNING - CONSIGNMENT
 Intermediate Financial Management (MindTap Course...FinanceISBN:9781337395083Author:Eugene F. Brigham, Phillip R. DavesPublisher:Cengage Learning
EBK CONTEMPORARY FINANCIAL MANAGEMENT
Finance
ISBN:9781337514835
Author:MOYER
Publisher:CENGAGE LEARNING - CONSIGNMENT
Intermediate Financial Management (MindTap Course...
Finance
ISBN:9781337395083
Author:Eugene F. Brigham, Phillip R. Daves
Publisher:Cengage Learning
Portfolio return, variance, standard deviation; Author: MyFinanceTeacher;https://www.youtube.com/watch?v=RWT0kx36vZE;License: Standard YouTube License, CC-BY