
Concept explainers
Videos
To determine: In this problem, by using the ticker symbol given, the five year data of monthly adjusted stock prices can be downloaded. After that returns can be calculated and returns data of respective company can be plotted on xy scatter plot against the data of S&P. Then by following the steps mentioned in the questions trend line can be made. Slope of the trend line will be beta of the stock.
Explanation of Solution
First we have to down load the data of Eli Lilly (LLY) for the period between Jan 2014 and Nov 2018 (Five years). Then the returns can be calculated by using this formula:
Where LN is natural logarithm
Now this is the calculated data here under for Eli Lily. Similarly S&P Data can be obtained and Returns can be calculated as mentioned above.
| LLY Company | S&P 500 | ||||
| Date | Adj Close | Return LLY | Date | Adj Close | Return S&P |
| 12/1/2013 | null | 0 | 12/1/2013 | null | 0 |
| 1/1/2014 | 46.83643 | 0 | 1/1/2014 | 1782.59 | 0 |
| 2/1/2014 | 51.692627 | 0.0986538 | 2/1/2014 | 1859.45 | 0.04221337 |
| 3/1/2014 | 51.505238 | -0.003632 | 3/1/2014 | 1872.34 | 0.00690825 |
| 4/1/2014 | 51.715252 | 0.0040692 | 4/1/2014 | 1883.95 | 0.00618164 |
| 5/1/2014 | 52.380283 | 0.0127775 | 5/1/2014 | 1923.57 | 0.0208122 |
| 6/1/2014 | 54.853989 | 0.0461447 | 6/1/2014 | 1960.23 | 0.018879 |
| 7/1/2014 | 53.874619 | -0.018015 | 7/1/2014 | 1930.67 | -0.0151947 |
| 8/1/2014 | 56.08041 | 0.0401271 | 8/1/2014 | 2003.37 | 0.03696364 |
| 9/1/2014 | 57.679146 | 0.0281091 | 9/1/2014 | 1972.29 | -0.0156354 |
| 10/1/2014 | 58.995499 | 0.0225655 | 10/1/2014 | 2018.05 | 0.0229364 |
| 11/1/2014 | 60.587559 | 0.0266284 | 11/1/2014 | 2067.56 | 0.02423747 |
| 12/1/2014 | 61.807735 | 0.0199389 | 12/1/2014 | 2058.9 | -0.0041974 |
| 1/1/2015 | 64.504379 | 0.0427046 | 1/1/2015 | 1994.99 | -0.0315328 |
| 2/1/2015 | 62.864899 | -0.025745 | 2/1/2015 | 2104.5 | 0.05343888 |
| 3/1/2015 | 65.551598 | 0.0418496 | 3/1/2015 | 2067.89 | -0.0175492 |
| 4/1/2015 | 64.847809 | -0.010794 | 4/1/2015 | 2085.51 | 0.00848472 |
| 5/1/2015 | 71.190941 | 0.0933225 | 5/1/2015 | 2107.39 | 0.01043673 |
| 6/1/2015 | 75.853432 | 0.0634374 | 6/1/2015 | 2063.11 | -0.0212356 |
| 7/1/2015 | 76.780136 | 0.012143 | 7/1/2015 | 2103.84 | 0.01954968 |
| 8/1/2015 | 74.817703 | -0.025891 | 8/1/2015 | 1972.18 | -0.0646247 |
| 9/1/2015 | 76.492958 | 0.0221442 | 9/1/2015 | 1920.03 | -0.0267987 |
| 10/1/2015 | 74.555267 | -0.025658 | 10/1/2015 | 2079.36 | 0.07971938 |
| 11/1/2015 | 74.984871 | 0.0057457 | 11/1/2015 | 2080.41 | 0.00050474 |
| 12/1/2015 | 77.502235 | 0.0330204 | 12/1/2015 | 2043.94 | -0.0176857 |
| 1/1/2016 | 72.756081 | -0.063194 | 1/1/2016 | 1940.24 | -0.0520676 |
| 2/1/2016 | 66.22551 | -0.094047 | 2/1/2016 | 1932.23 | -0.0041369 |
| 3/1/2016 | 66.695992 | 0.0070791 | 3/1/2016 | 2059.74 | 0.06390499 |
| 4/1/2016 | 69.95623 | 0.0477249 | 4/1/2016 | 2065.3 | 0.00269576 |
| 5/1/2016 | 69.493126 | -0.006642 | 5/1/2016 | 2096.95 | 0.01520837 |
| 6/1/2016 | 73.425682 | 0.0550459 | 6/1/2016 | 2098.86 | 0.00091051 |
| 7/1/2016 | 77.285789 | 0.0512363 | 7/1/2016 | 2173.6 | 0.03499043 |
| 8/1/2016 | 72.493301 | -0.064016 | 8/1/2016 | 2170.95 | -0.00122 |
| 9/1/2016 | 75.310425 | 0.0381244 | 9/1/2016 | 2168.27 | -0.0012352 |
| 10/1/2016 | 69.286331 | -0.083371 | 10/1/2016 | 2126.15 | -0.0196168 |
| 11/1/2016 | 62.980747 | -0.095419 | 11/1/2016 | 2198.81 | 0.03360355 |
| 12/1/2016 | 69.921356 | 0.104542 | 12/1/2016 | 2238.83 | 0.01803711 |
| 1/1/2017 | 73.229668 | 0.0462295 | 1/1/2017 | 2278.87 | 0.01772631 |
| 2/1/2017 | 78.724503 | 0.0723538 | 2/1/2017 | 2363.64 | 0.036523 |
| 3/1/2017 | 80.498466 | 0.0222837 | 3/1/2017 | 2362.72 | -0.0003893 |
| 4/1/2017 | 78.536491 | -0.024675 | 4/1/2017 | 2384.2 | 0.00905013 |
| 5/1/2017 | 76.153404 | -0.030814 | 5/1/2017 | 2411.8 | 0.01150976 |
| 6/1/2017 | 79.274796 | 0.0401705 | 6/1/2017 | 2423.41 | 0.00480223 |
| 7/1/2017 | 79.621574 | 0.0043648 | 7/1/2017 | 2470.3 | 0.01916402 |
| 8/1/2017 | 78.301926 | -0.016713 | 8/1/2017 | 2471.65 | 0.00054628 |
| 9/1/2017 | 82.921219 | 0.0573188 | 9/1/2017 | 2519.36 | 0.01911904 |
| 10/1/2017 | 79.431435 | -0.042997 | 10/1/2017 | 2575.26 | 0.02194556 |
| 11/1/2017 | 82.048775 | 0.0324197 | 11/1/2017 | 2584.84 | 0.00371314 |
| 12/1/2017 | 82.39135 | 0.0041666 | 12/1/2017 | 2673.61 | 0.03376601 |
| 1/1/2018 | 79.45507 | -0.036289 | 1/1/2018 | 2823.81 | 0.0546574 |
| 2/1/2018 | 75.133568 | -0.055924 | 2/1/2018 | 2713.83 | -0.0397261 |
| 3/1/2018 | 76.036209 | 0.0119422 | 3/1/2018 | 2640.87 | -0.0272525 |
| 4/1/2018 | 79.672424 | 0.0467139 | 4/1/2018 | 2648.05 | 0.00271509 |
| 5/1/2018 | 83.573997 | 0.0478089 | 5/1/2018 | 2705.27 | 0.02137819 |
| 6/1/2018 | 84.436729 | 0.0102701 | 6/1/2018 | 2718.37 | 0.00483075 |
| 7/1/2018 | 97.77562 | 0.1466728 | 7/1/2018 | 2816.29 | 0.03538795 |
| 8/1/2018 | 104.544014 | 0.0669329 | 8/1/2018 | 2901.52 | 0.02981431 |
| 9/1/2018 | 106.772926 | 0.0210962 | 9/1/2018 | 2913.98 | 0.00428509 |
| 10/1/2018 | 107.89727 | 0.0104752 | 10/1/2018 | 2711.74 | -0.0719293 |
| 11/1/2018 | 118.046219 | 0.0898967 | 11/1/2018 | 2760.17 | 0.01770175 |
| 12/1/2018 | 115.839996 | -0.018866 | 12/1/2018 | 2695.95 | -0.0235416 |
| 12/6/2018 | 115.839996 | 0 | 12/6/2018 | 2695.95 | 0 |
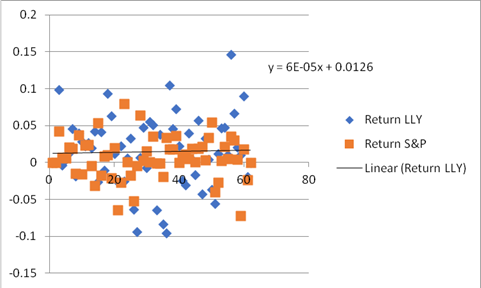
Now scatter plot between return of Eli Lilly and S&P 500 can be made like this:
The trend line can also be obtained by clicking on any blue point and following the steps. This trend line shows that the slope is -0.0004. This slope is beta of Stock Eli Lilly.
Similarly data can be obtained for the next firm AA and returns can be calculated.
| AA Company | S&P 500 | ||||
| Date | Adj Close | Return AA | Date | Adj Close | Return S&P |
| 12/1/2013 | null | 0 | 12/1/2013 | null | 0 |
| 1/1/2014 | 26.76451 | 0 | 1/1/2014 | 1782.59 | 0 |
| 2/1/2014 | 27.29933 | 0.019786 | 2/1/2014 | 1859.45 | 0.04221337 |
| 3/1/2014 | 30.00557 | 0.094521 | 3/1/2014 | 1872.34 | 0.00690825 |
| 4/1/2014 | 31.40442 | 0.045566 | 4/1/2014 | 1883.95 | 0.00618164 |
| 5/1/2014 | 31.73083 | 0.01034 | 5/1/2014 | 1923.57 | 0.0208122 |
| 6/1/2014 | 34.79342 | 0.09214 | 6/1/2014 | 1960.23 | 0.018879 |
| 7/1/2014 | 38.29848 | 0.095982 | 7/1/2014 | 1930.67 | -0.0151947 |
| 8/1/2014 | 38.81255 | 0.013333 | 8/1/2014 | 2003.37 | 0.03696364 |
| 9/1/2014 | 37.6662 | -0.02998 | 9/1/2014 | 1972.29 | -0.0156354 |
| 10/1/2014 | 39.23465 | 0.040797 | 10/1/2014 | 2018.05 | 0.0229364 |
| 11/1/2014 | 40.47537 | 0.031133 | 11/1/2014 | 2067.56 | 0.02423747 |
| 12/1/2014 | 37.031 | -0.08894 | 12/1/2014 | 2058.9 | -0.0041974 |
| 1/1/2015 | 36.70266 | -0.00891 | 1/1/2015 | 1994.99 | -0.0315328 |
| 2/1/2015 | 34.68578 | -0.05652 | 2/1/2015 | 2104.5 | 0.05343888 |
| 3/1/2015 | 30.35504 | -0.13337 | 3/1/2015 | 2067.89 | -0.0175492 |
| 4/1/2015 | 31.52978 | 0.03797 | 4/1/2015 | 2085.51 | 0.00848472 |
| 5/1/2015 | 29.36827 | -0.07102 | 5/1/2015 | 2107.39 | 0.01043673 |
| 6/1/2015 | 26.25399 | -0.1121 | 6/1/2015 | 2063.11 | -0.0212356 |
| 7/1/2015 | 23.24008 | -0.12194 | 7/1/2015 | 2103.84 | 0.01954968 |
| 8/1/2015 | 22.25113 | -0.04349 | 8/1/2015 | 1972.18 | -0.0646247 |
| 9/1/2015 | 22.81595 | 0.025067 | 9/1/2015 | 1920.03 | -0.0267987 |
| 10/1/2015 | 21.09177 | -0.07858 | 10/1/2015 | 2079.36 | 0.07971938 |
| 11/1/2015 | 22.10739 | 0.047029 | 11/1/2015 | 2080.41 | 0.00050474 |
| 12/1/2015 | 23.38675 | 0.056258 | 12/1/2015 | 2043.94 | -0.0176857 |
| 1/1/2016 | 17.2735 | -0.303 | 1/1/2016 | 1940.24 | -0.0520676 |
| 2/1/2016 | 21.15944 | 0.202913 | 2/1/2016 | 1932.23 | -0.0041369 |
| 3/1/2016 | 22.79773 | 0.074575 | 3/1/2016 | 2059.74 | 0.06390499 |
| 4/1/2016 | 26.58148 | 0.153554 | 4/1/2016 | 2065.3 | 0.00269576 |
| 5/1/2016 | 22.06001 | -0.18645 | 5/1/2016 | 2096.95 | 0.01520837 |
| 6/1/2016 | 22.12414 | 0.002903 | 6/1/2016 | 2098.86 | 0.00091051 |
| 7/1/2016 | 25.3461 | 0.135956 | 7/1/2016 | 2173.6 | 0.03499043 |
| 8/1/2016 | 24.05732 | -0.05219 | 8/1/2016 | 2170.95 | -0.00122 |
| 9/1/2016 | 24.27107 | 0.008846 | 9/1/2016 | 2168.27 | -0.0012352 |
| 10/1/2016 | 21.3561 | -0.12795 | 10/1/2016 | 2126.15 | -0.0196168 |
| 11/1/2016 | 28.85664 | 0.301002 | 11/1/2016 | 2198.81 | 0.03360355 |
| 12/1/2016 | 28.08 | -0.02728 | 12/1/2016 | 2238.83 | 0.01803711 |
| 1/1/2017 | 36.45 | 0.260884 | 1/1/2017 | 2278.87 | 0.01772631 |
| 2/1/2017 | 34.59 | -0.05238 | 2/1/2017 | 2363.64 | 0.036523 |
| 3/1/2017 | 34.4 | -0.00551 | 3/1/2017 | 2362.72 | -0.0003893 |
| 4/1/2017 | 33.73 | -0.01967 | 4/1/2017 | 2384.2 | 0.00905013 |
| 5/1/2017 | 32.94 | -0.0237 | 5/1/2017 | 2411.8 | 0.01150976 |
| 6/1/2017 | 32.65 | -0.00884 | 6/1/2017 | 2423.41 | 0.00480223 |
| 7/1/2017 | 36.4 | 0.108724 | 7/1/2017 | 2470.3 | 0.01916402 |
| 8/1/2017 | 43.88 | 0.18689 | 8/1/2017 | 2471.65 | 0.00054628 |
| 9/1/2017 | 46.62 | 0.060571 | 9/1/2017 | 2519.36 | 0.01911904 |
| 10/1/2017 | 47.78 | 0.024578 | 10/1/2017 | 2575.26 | 0.02194556 |
| 11/1/2017 | 41.51 | -0.14067 | 11/1/2017 | 2584.84 | 0.00371314 |
| 12/1/2017 | 53.87 | 0.260639 | 12/1/2017 | 2673.61 | 0.03376601 |
| 1/1/2018 | 52.02 | -0.03495 | 1/1/2018 | 2823.81 | 0.0546574 |
| 2/1/2018 | 44.97 | -0.14563 | 2/1/2018 | 2713.83 | -0.0397261 |
| 3/1/2018 | 44.96 | -0.00022 | 3/1/2018 | 2640.87 | -0.0272525 |
| 4/1/2018 | 51.2 | 0.129966 | 4/1/2018 | 2648.05 | 0.00271509 |
| 5/1/2018 | 48.07 | -0.06308 | 5/1/2018 | 2705.27 | 0.02137819 |
| 6/1/2018 | 46.88 | -0.02507 | 6/1/2018 | 2718.37 | 0.00483075 |
| 7/1/2018 | 43.27 | -0.08013 | 7/1/2018 | 2816.29 | 0.03538795 |
| 8/1/2018 | 44.67 | 0.031843 | 8/1/2018 | 2901.52 | 0.02981431 |
| 9/1/2018 | 40.4 | -0.10047 | 9/1/2018 | 2913.98 | 0.00428509 |
| 10/1/2018 | 34.99 | -0.14377 | 10/1/2018 | 2711.74 | -0.0719293 |
| 11/1/2018 | 31.81 | -0.09528 | 11/1/2018 | 2760.17 | 0.01770175 |
| 12/1/2018 | 29.65 | -0.07032 | 12/1/2018 | 2695.95 | -0.0235416 |
| 12/6/2018 | 29.65 | 0 | 12/6/2018 | 2695.95 | 0 |
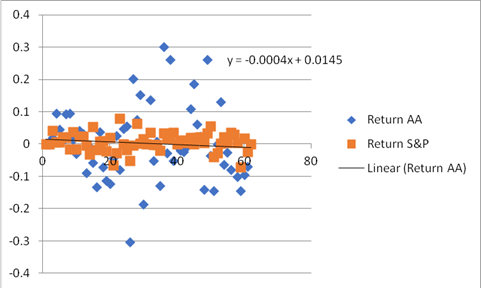
Then we can again prepare scatter plot between returns of AA and S&P like mentioned below.
Scatter Plot can be made by using MS Excel plot function by selecting Returns of LLY and S&P.4
The scatter plot will look like this.
Also then we can insert regression equation. The regression equation will look like this:
Y = 6E-05x + 0.0126
 t
t
Now from the trend line we have the slope of trend line that shows that beta of stock AA is -0.00006.
The result shows that Eli Lilly has a negative beta and AA has positive beta. Eli Lilly's negative beta is useful to diversify the portfolio in which this stock would be added, for the reason that this stock's returns are negatively correlated with market returns and thus increasing diversification, lowering risk at the cost of less expected returns.
Want to see more full solutions like this?
Chapter 6 Solutions
ESSENTIALS OF INVESTMENTS SELECT CHAPT


- Smiley Corporation's current sales and partial balance sheet are shown below. This year Sales $ 10,000 Balance Sheet: Liabilities Accounts payable $ 2,000 Notes payable $ 2,000 Accruals $ 1,400 Total current liabilities $ 5,400 Long-term bonds $ 2,000 Total liabilities $ 7,400 Common stock $ 1,000 Retained earnings $ 2,500 Total common equity $ 3,500 Total liabilities & equity $ 10,900 Sales are expected to grow by 8% next year. Assuming no change in operations from this year to next year, what are the projected spontaneous liabilities? Do not round intermediate calculations. Round your answer to the nearest dollar.arrow_forwardDiscuss in detail the similarities and differences between Preferred Stock and Common Stock. As an investor, which would you rather invest in if you goal is long term wealth maximization?arrow_forwardAnswer itarrow_forward
- QUESTION #1: A) What is the Net Operating Profit After Tax (NOPAT) for 2024?B) What is the Operating Cash Flow for 2024? C) What is the Free Cash Flow for 2024? Note: Marketable securities are non-operating current assets, and short-term debt (bank loan) is a non-operating current liability. Both of these items are excluded from the calculation of net operating working capital. D) If the stock trades for $85 per share at the end of 2024, and there are 315,000 shares outstanding, what is the MVA in 2024? E) Given that the firm’s WACC is 14%, what is the EVA during 2024? F) Create common size income statement and balance sheet for 2024, 2023 and 2022. G) Using 2022 as the base year, create income statement and balance sheet percentage change analysis for 2024 and 2023. QUESTION #2: In addition to the AAA Ltd. financial statements in Problem One, you are given more information as follows. Sales are forecast to increase by 80% in 2025. Short-term Debt, Long-term Debt, and Common…arrow_forwardBrightwoodę Furniture provides the following financial data for a given enod: Sales Less Variable E Contribwaon Margin Less Fixed Expenses et Income - Aount ($) Per Unit ($) 150,000 3 L96,000 13 10 35,000 25,000 a. What is the company's CM ratio? b. If quarterly sales increase by $5,200 and there is no change in fixed expenses, by how much would you expect quarterly net operating income to increase?arrow_forwardIf image is blurr then comment i will write values in comment . dont amswer with unclear data i will give unhelarrow_forward
- QUESTION #1: ABC Inc. is debating the purchase of a new digital printer that will replace an older printer. The printer they acquired 2 years ago for $500,000 is worth $220,000 today and will have a salvage value of $80,000 after 5 more years. The printer generates revenues of $750,000 per year. The costs of operating the printer are $480,000 per year. The company currently has $110,000 invested in net operating working capital. The investment in net operating working capital will remain at this level for the remaining 5 years of the project. The new printer will cost $830,000. It will cost $60,000 to install the new printer. The new printer will generate revenues of $1,120,000 per year. In addition, the costs of operating the new printer will be $550,000 per year. The company will have to increase its investment in net operating working capital to $175,000 at time zero. The investment in operating new working capital will remain at this level for the remaining 5 years of the…arrow_forwardQUESTION #1: ABC Inc. is debating the purchase of a new digital printer that will replace an older printer. The printer they acquired 2 years ago for $500,000 is worth $220,000 today and will have a salvage value of $80,000 after 5 more years. The printer generates revenues of $750,000 per year. The costs of operating the printer are $480,000 per year. The company currently has $110,000 invested in net operating working capital. The investment in net operating working capital will remain at this level for the remaining 5 years of the project. The new printer will cost $830,000. It will cost $60,000 to install the new printer. The new printer will generate revenues of $1,120,000 per year. In addition, the costs of operating the new printer will be $550,000 per year. The company will have to increase its investment in net operating working capital to $175,000 at time zero. The investment in operating new working capital will remain at this level for the remaining 5 years of the…arrow_forwardQUESTION #1: A) What is the Net Operating Profit After Tax (NOPAT) for 2024?B) What is the Operating Cash Flow for 2024? C) What is the Free Cash Flow for 2024? Note: Marketable securities are non-operating current assets, and short-term debt (bank loan) is a non-operating current liability. Both of these items are excluded from the calculation of net operating working capital. D) If the stock trades for $85 per share at the end of 2024, and there are 315,000 shares outstanding, what is the MVA in 2024? E) Given that the firm’s WACC is 14%, what is the EVA during 2024? F) Create common size income statement and balance sheet for 2024, 2023 and 2022. G) Using 2022 as the base year, create income statement and balance sheet percentage change analysis for 2024 and 2023. QUESTION #2: In addition to the AAA Ltd. financial statements in Problem One, you are given more information as follows. Sales are forecast to increase by 80% in 2025. Short-term Debt, Long-term Debt, and Common…arrow_forward
- QUESTION #1: ABC Inc. is debating the purchase of a new digital printer that will replace an older printer. The printer they acquired 2 years ago for $500,000 is worth $220,000 today and will have a salvage value of $80,000 after 5 more years. The printer generates revenues of $750,000 per year. The costs of operating the printer are $480,000 per year. The company currently has $110,000 invested in net operating working capital. The investment in net operating working capital will remain at this level for the remaining 5 years of the project. The new printer will cost $830,000. It will cost $60,000 to install the new printer. The new printer will generate revenues of $1,120,000 per year. In addition, the costs of operating the new printer will be $550,000 per year. The company will have to increase its investment in net operating working capital to $175,000 at time zero. The investment in operating new working capital will remain at this level for the remaining 5 years of the…arrow_forwardSolve!arrow_forwardQUESTION #1: A) What is the Net Operating Profit After Tax (NOPAT) for 2024?B) What is the Operating Cash Flow for 2024? C) What is the Free Cash Flow for 2024? Note: Marketable securities are non-operating current assets, and short-term debt (bank loan) is a non-operating current liability. Both of these items are excluded from the calculation of net operating working capital. D) If the stock trades for $85 per share at the end of 2024, and there are 315,000 shares outstanding, what is the MVA in 2024? E) Given that the firm’s WACC is 14%, what is the EVA during 2024? F) Create common size income statement and balance sheet for 2024, 2023 and 2022. G) Using 2022 as the base year, create income statement and balance sheet percentage change analysis for 2024 and 2023. QUESTION #2: In addition to the AAA Ltd. financial statements in Problem One, you are given more information as follows. Sales are forecast to increase by 80% in 2025. Short-term Debt, Long-term Debt, and Common…arrow_forward
 Essentials Of InvestmentsFinanceISBN:9781260013924Author:Bodie, Zvi, Kane, Alex, MARCUS, Alan J.Publisher:Mcgraw-hill Education,

 Foundations Of FinanceFinanceISBN:9780134897264Author:KEOWN, Arthur J., Martin, John D., PETTY, J. WilliamPublisher:Pearson,
 Fundamentals of Financial Management (MindTap Cou...FinanceISBN:9781337395250Author:Eugene F. Brigham, Joel F. HoustonPublisher:Cengage Learning
 Corporate Finance (The Mcgraw-hill/Irwin Series i...FinanceISBN:9780077861759Author:Stephen A. Ross Franco Modigliani Professor of Financial Economics Professor, Randolph W Westerfield Robert R. Dockson Deans Chair in Bus. Admin., Jeffrey Jaffe, Bradford D Jordan ProfessorPublisher:McGraw-Hill Education