Foundations Of Finance
10th Edition
ISBN: 9780134897264
Author: KEOWN, Arthur J., Martin, John D., PETTY, J. William
Publisher: Pearson,
expand_more
expand_more
format_list_bulleted
Concept explainers
Textbook Question
Chapter 6, Problem 1SP
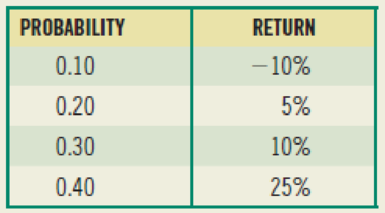
(Expected return and risk) Universal Corporation is planning to invest in a security that has several possible
Expert Solution & Answer
Want to see the full answer?
Check out a sample textbook solutionStudents have asked these similar questions
The higher a security's risk, the higher the return investors demand, and thus the less they are willing to pay for the investment. What do you understand from the statement mentioned above? Explain with necessary numerical data, and illustrate by means of a chart.
What is the equation for the Security Market Line? Define each term. If an asset has a beta of 2.0, what type of return should it realize compared to the market portfolio?
Based on the following probability distribution, what is the security's expected
return?
State
Probability
1
0.2
-5.0%
2
0.3
10.0
3
0.5
30.0
What is the expected return of the following investment?
Probability
Payoff
Chapter 6 Solutions
Foundations Of Finance
Ch. 6 - a. What is meant by the investors required rate of...Ch. 6 - Prob. 2RQCh. 6 - What is a beta? How is it used to calculate r, the...Ch. 6 - Prob. 4RQCh. 6 - Prob. 5RQCh. 6 - Prob. 6RQCh. 6 - Prob. 7RQCh. 6 - What effect will diversifying your portfolio have...Ch. 6 - (Expected return and risk) Universal Corporation...Ch. 6 - (Average expected return and risk) Given the...
Ch. 6 - (Expected rate of return and risk) Carter, Inc. is...Ch. 6 - (Expected rate of return and risk) Summerville,...Ch. 6 - Prob. 5SPCh. 6 - Prob. 9SPCh. 6 - Prob. 10SPCh. 6 - Prob. 11SPCh. 6 - Prob. 12SPCh. 6 - Prob. 14SPCh. 6 - (Capital asset pricing model) Using the CAPM,...Ch. 6 - Prob. 16SPCh. 6 - Prob. 17SPCh. 6 - a. Compute an appropriate rate of return for Intel...Ch. 6 - (Estimating beta) From the graph in the right...Ch. 6 - Prob. 20SPCh. 6 - Prob. 21SPCh. 6 - (Capital asset pricing model) The expected return...Ch. 6 - (Portfolio beta and security market line) You own...Ch. 6 - (Portfolio beta) Assume you have the following...Ch. 6 - Prob. 1MCCh. 6 - Prob. 2MCCh. 6 - Prob. 3MCCh. 6 - Prob. 4MCCh. 6 - Prob. 5MCCh. 6 - Prob. 6MCCh. 6 - Prob. 7MCCh. 6 - Prob. 8MCCh. 6 - Prob. 9MCCh. 6 - Prob. 10MCCh. 6 - Prob. 11MC
Knowledge Booster
Learn more about
Need a deep-dive on the concept behind this application? Look no further. Learn more about this topic, finance and related others by exploring similar questions and additional content below.Similar questions
- Expected returnarrow_forwardExploring Finance: Security Market Line. Security Market Line Conceptual Overview: Explore the determinants of the security market line. The Security Market Line defines the required rate of return for a security to be worth buying or holding. The line, depicted in blue in the graph, is the sum of the risk-free return (rf in the slider) and a risk premium determined by the market-risk premium (RPM) multiplied by the security's beta coefficient for risk. Drag the rf slider below the graph to change the amount of the risk-free return. These changes reflect changes in inflation. Drag the RPM slider below the graph to change the relationship between a security's beta coefficient and the amount of the market risk premium. Drag left or right on the graph to move the cursor line to evaluate securities with different beta coefficients. r = r_{RF} + RP_M * beta = 6\% + 5\% * 1 = 6\% + 5.00\% = 11.00\%r=rRF+RPM∗beta=6%+5%∗1=6%+5.00%=11.00% 1. For a risk-free return rate of 5%, a…arrow_forwardWhich of the following statements about the Security Market Line are correct? I. The intercept point is the market rate of return. II. The slope of the line is beta. III. An investor should accept any return located above the SML line. IV. A beta of 0.0 indicates the risk-free rate of returnarrow_forward
- Using the data generated in the graph, show what the information looks like in a spreadsheet. a) Plot the Security Market Line (SML) b) Superimpose the CAPM’s required return on the SML c) Indicate which investments will plot on, above, and below the SML? d) If an investment’s expected return (mean return) does not plot on the SML, what does it show? Identify undervalued/overvalued investments from the graph.arrow_forwardThe expected rate of return of an investment ________. a. equals one of the possible rates of return for that investment b. equals the required rate of return for the investment c. is the mean value of the probability distribution of possible returns d. is the median value of the probability distribution of possible returns e. is the mode value of the probability distribution of possible returnsarrow_forwardWrite out the equation for the Capital Market Line (CML), and draw it on the graph. Interpret the plotted CML. Now add a set of indifference curves and illustrate how an investors optimal portfolio is some combination of the risky portfolio and the risk-free asset. What is the composition of the risky portfolio?arrow_forward
- Calculate the expected return from the following security using the CAPM Capital Asset Pricing Model: Standard Deviation of Security = 0.18 Standard Deviation of Market Portfolio = 0.10 Expected Return on Market Portfolio = 0.09 Correlation between possible Returns for the Security and the Market Portfolio = 0.70. Expected Risk Free Rate = 0.03arrow_forwardWith the assistance of an annotated graph, explain when a security is overpriced, under-priced or fairly priced according to the Capital Asset Pricing Model., when the calculated expected rate of return of a security is 12.2% and the actual expected rate of return on a security is 10%.arrow_forwardJerome J. Jerome is considering investing in a security that has the following distribution of possible one-year returns: Probability of occurrence 0.10 0.20 0.30 0.30 0.10 Possible return −0.10 0.00 0.10 0.20 0.30 a. What is the expected return and standard deviation associated with the investment?arrow_forward
- The market portfolio (M) has the expected rate of return E(rM) = 0.12. Security A is traded in the market. We know that E(rA) = 0.17 and βA = 1.5. (1) What is the rate of return of the risk-free asset (rf)? (2) Security B is also traded in the market. βB = 0.8. Then what is “fair” expected rate of return of security B according to the CAPM? (3) Security C is a third security traded in the market. βC = 0.6, and from the market price, investors calculate E(rC) = 0.1. Is C overpriced or underpriced? What is αC?arrow_forwardThe portfolio weights for a portfolio consisting of multiple securities given multiple states of the economy are based on the: a. expected rates of return of each security given a normal economic state. b. market value of the investment in each individual security. c. beta of each individual security. d. amount of the original investment in each security.arrow_forwardThe security market line depicts: a. Expected return as a function of systematic risk (indicated by beta) b. The market portfolio as the optimal portfolio of risky assets c. The relationship between a security’s return and the return on the index d. Portfolio combinations of the market portfolio and the risk-free asset e. Expected return as a function of volatilityarrow_forward
arrow_back_ios
SEE MORE QUESTIONS
arrow_forward_ios
Recommended textbooks for you
- EBK CONTEMPORARY FINANCIAL MANAGEMENTFinanceISBN:9781337514835Author:MOYERPublisher:CENGAGE LEARNING - CONSIGNMENTIntermediate Financial Management (MindTap Course...FinanceISBN:9781337395083Author:Eugene F. Brigham, Phillip R. DavesPublisher:Cengage Learning
EBK CONTEMPORARY FINANCIAL MANAGEMENT
Finance
ISBN:9781337514835
Author:MOYER
Publisher:CENGAGE LEARNING - CONSIGNMENT
Intermediate Financial Management (MindTap Course...
Finance
ISBN:9781337395083
Author:Eugene F. Brigham, Phillip R. Daves
Publisher:Cengage Learning
Portfolio Management; Author: DevTechFinance;https://www.youtube.com/watch?v=Qmw15cG2Mv4;License: Standard YouTube License, CC-BY