
Concept explainers
(a)
Time mean speed.
Answer to Problem 1P
The time mean speed is
Explanation of Solution
Given:
Observers stationed at two sections XX and YY, 500 ft apart on a highway, recording the time of vehicles on their arrival as shown in the accompanying table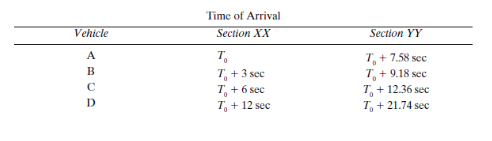
The total time of observation at XX was 15 sec.
In order to calculate time mean speed, we need to figure out traveling time of each vehicle which is the difference of time taken by a vehicle in travelling from XX to YY section between the two sections.
Calculation:
| Vehicles | Section XX | Section YY | Travelling time of vehicle, |
| A | | | |
| B | | | |
| C | | | |
| D | | | |
We have the following formula for the time mean speed:
Where,
n is the number of the vehicles passing.
Now, the speed of the individual vehicles is as follows:
Speed of vehicle A:
Speed of vehicle B:
Speed of vehicle C:
Speed of vehicle D:
Now, the time mean speed can be calculated by substituting the values in the following formula:
Conclusion:
Therefore, the time mean speed is
(b)
Space mean speed.
Answer to Problem 1P
The time mean speed is
Explanation of Solution
Given:
Observers stationed at two sections XX and YY, 500 ft apart on a highway, recording the time of vehicles on their arrivalas shown in the accompanying table.

The total time of observation at XX was 15 sec.
Calculation:
We have the following formula for finding out the space mean speed.
Where,
Substitute the values, we have:
Conclusion:
Therefore, the time mean speed is
(c)
Flow at section XX.
Answer to Problem 1P
The flow at section XX is as follows
Explanation of Solution
Given:
Observers stationed at two sections XX and YY, 500 ft apart on a highway, recording the time of vehicles on their arrival as shown in the accompanying table.

The total time of observation at XX was 15 sec.
Calculation:
We have the following formula for finding out the flow at XX section.
Where,
Substitute the values, we have:
Conclusion:
Therefore, the flow at section XX is as follows
Want to see more full solutions like this?
Chapter 6 Solutions
Traffic And Highway Engineering


- Problem 2 (A is fixed and C is a pin) Find the reactions and A and C. 10 k- 6 ft 6 ft B A 2 k/ft 15 ftarrow_forward6. A lake with no outlet is fed by a river with a constant flow of 1200 ft3/s. Water evaporates from the surface at a constant rate of 13 ft3/s per square mile of surface area. The surface area varies with the depth h (in feet) as A (square miles) = 4.5 + 5.5h. What is the equilibrium depth of the lake? Below what river discharge (volume flow rate) will the lake dry up?arrow_forwardProblem 5 (A, B, C and D are fixed). Find the reactions at A and D 8 k B 15 ft A -20 ft C 10 ft Darrow_forward
- Problem 4 (A, B, E, D and F are all pin connected and C is fixed) Find the reactions at A, D and F 8 m B 6m E 12 kN D F 4 marrow_forwardProblem 1 (A, C and D are pins) Find the reactions and A, C and D. D 6 m B 12 kN/m 8 m A C 6 marrow_forwardUniform Grade of Pipe Station of Point A is 9+50.00. Elevation Point A = 250.75.Station of Point B is 13+75.00. Elevation Point B = 244.10 1) Calculate flowline of pipe elevations at every 50 ft. interval (Half Station). 2) Tabulate station and elevation for each station like shown on example 3) Draw Sketcharrow_forward
- quantity surveyingarrow_forwardNote: Please accurately answer it!. I'll give it a thumbs up or down based on the answer quality and precision. Question: What is the group name of Sample B in problem 3 from the image?. By also using the ASTM flow chart!. This unit is soil mechanics btwarrow_forwardPick the rural location of a project site in Victoria, and its catchment area-not bigger than 25 sqkm, and given the below information, determine the rainfall intensity for ARI = 5, 50, 100 year storm event. Show all the details of the procedure. Each student must propose different length of streams and elevations. Use fig below as a sample only. Pt. E-ht. 95.0 200m 600m PLD-M. 91.0 300m Pt. C-93.0 300m PL.B-ht. 92.0 PL.F-ht. 96.0 500m Pt. A-M. 91.00 To be deemed satisfactory the solution must include: Q.F1.1.Choice of catchment location Q.F1.2. A sketch displaying length of stream and elevation Q.F1.3. Catchment's IFD obtained from the Buro of Metheorology for specified ARI Q.F1.4.Calculation of the time of concentration-this must include a detailed determination of the equivalent slope. Q.F1.5.Use must be made of the Bransby-Williams method for the determination of the equivalent slope. Q.F1.6.The graphical display of the estimation of intensities for ARI 5,50, 100 must be shown.arrow_forward
 Traffic and Highway EngineeringCivil EngineeringISBN:9781305156241Author:Garber, Nicholas J.Publisher:Cengage Learning