
Concept explainers
Videos
(a) Draw two typical curves y = f(x) and y = g(x), where f(x) ≥ g(x) for a ≤ x ≤ b. Show how to approximate the area between these curves by a Riemann sum and sketch the corresponding approximating rectangles. Then write an expression for the exact area.
(b) Explain how the situation changes if the curves have equations x = f(y) and x = g(y), where f(y) ≥ g(y) for c ≤ y ≤ d.
(a)
To Draw: the two typical curves
To define: A Riemann sum that approximates the area between the two typical curves with drawing of the corresponding approximating rectangles and exact area between the two typical curves and the expression for the exact area.
Explanation of Solution
Consider the two curves
Here, the top curve function is
Assume f and g are continuous function and
Here, the lower limit is a and the upper limit is b.
Show the approximate ith strip rectangle with base
Sketch the two typical curves
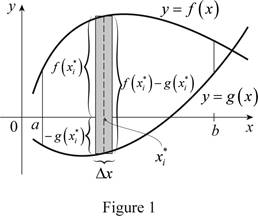
Refer to figure 1.
The two typical curves
The expression for the exact area is
Divide the area between the two typical curves into n strips of equal width and take the entire sample points to be right endpoints, in which
Sketch thecorresponding approximating rectangles as shown in Figure 2.
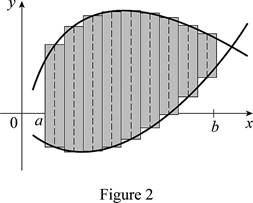
The better and better approximation occurs in
Thus, the Riemann sum with the sketch of corresponding approximating rectangles and the exact area between the two typical curves shown.
Therefore, the approximation of the area between the two typical curves using Riemann sum with the sketch of the corresponding approximating rectangles and the sum of the areas corresponding approximating rectangles is the exact area.
(b)
To Draw: The two typical curves with the changing the situation as
To define: The situation if the curves changes from
The expression for the exact area is
Explanation of Solution
Consider the two curves
Here, the right curve function is
Assume f and g are continuous function and
Here, the bottom limit is c and the top limit is d.
Sketch the two typical curves
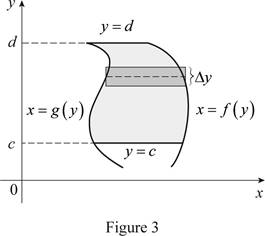
Thus, the two typical curves
Normally the height calculated from the top function minus bottom one and integrating from left to right. Instead of normal calculation, use “right minus left” and integrating from bottom to top. Therefore the exact area, A written as
Therefore, the changes of the situation if the curves have equations
Want to see more full solutions like this?
Chapter 6 Solutions
Calculus, Early Transcendentals


- 2. Find a matrix A with the following qualities a. A is 3 x 3. b. The matrix A is not lower triangular and is not upper triangular. c. At least one value in each row is not a 1, 2,-1, -2, or 0 d. A is invertible.arrow_forwardFind the exact area inside r=2sin(2\theta ) and outside r=\sqrt(3)arrow_forwardA 20 foot ladder rests on level ground; its head (top) is against a vertical wall. The bottom of the ladder begins by being 12 feet from the wall but begins moving away at the rate of 0.1 feet per second. At what rate is the top of the ladder slipping down the wall? You may use a calculator.arrow_forward
- Explain the key points and reasons for the establishment of 12.3.2(integral Test)arrow_forwardUse 12.4.2 to determine whether the infinite series on the right side of equation 12.6.5, 12.6.6 and 12.6.7 converges for every real number x.arrow_forwarduse Cauchy Mean-Value Theorem to derive Corollary 12.6.2, and then derive 12.6.3arrow_forward
 Algebra & Trigonometry with Analytic GeometryAlgebraISBN:9781133382119Author:SwokowskiPublisher:Cengage
 Trigonometry (MindTap Course List)TrigonometryISBN:9781337278461Author:Ron LarsonPublisher:Cengage Learning

 College Algebra (MindTap Course List)AlgebraISBN:9781305652231Author:R. David Gustafson, Jeff HughesPublisher:Cengage Learning
 Functions and Change: A Modeling Approach to Coll...AlgebraISBN:9781337111348Author:Bruce Crauder, Benny Evans, Alan NoellPublisher:Cengage Learning