Concept explainers
(a) Draw two typical curves y = f(x) and y = g(x), where f(x) ≥ g(x) for a ≤ x ≤ b. Show how to approximate the area between these curves by a Riemann sum and sketch the corresponding approximating rectangles. Then write an expression for the exact area.
(b) Explain how the situation changes if the curves have equations x = f(y) and x = g(y), where f(y) ≥ g(y) for c ≤ y ≤ d.
(a)
To Draw: the two typical curves
To define: A Riemann sum that approximates the area between the two typical curves with drawing of the corresponding approximating rectangles and exact area between the two typical curves and the expression for the exact area.
Explanation of Solution
Consider the two curves
Here, the top curve function is
Assume f and g are continuous function and
Here, the lower limit is a and the upper limit is b.
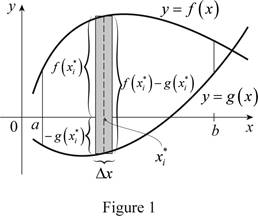
Show the approximate ith strip rectangle with base
Sketch the two typical curves

Refer to figure 1.
The two typical curves
The expression for the exact area is
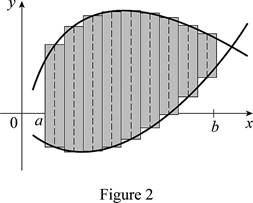
Divide the area between the two typical curves into n strips of equal width and take the entire sample points to be right endpoints, in which
Sketch thecorresponding approximating rectangles as shown in Figure 2.

The better and better approximation occurs in
Thus, the Riemann sum with the sketch of corresponding approximating rectangles and the exact area between the two typical curves shown.
Therefore, the approximation of the area between the two typical curves using Riemann sum with the sketch of the corresponding approximating rectangles and the sum of the areas corresponding approximating rectangles is the exact area.
(b)
To Draw: The two typical curves with the changing the situation as
To define: The situation if the curves changes from
The expression for the exact area is
Explanation of Solution
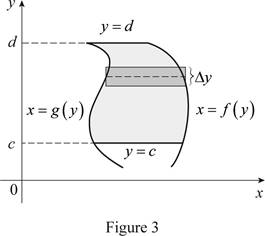
Consider the two curves
Here, the right curve function is
Assume f and g are continuous function and
Here, the bottom limit is c and the top limit is d.
Sketch the two typical curves

Thus, the two typical curves
Normally the height calculated from the top function minus bottom one and integrating from left to right. Instead of normal calculation, use “right minus left” and integrating from bottom to top. Therefore the exact area, A written as
Therefore, the changes of the situation if the curves have equations
Want to see more full solutions like this?
Chapter 6 Solutions
Calculus: Early Transcendentals, Loose-leaf Version, 9th
- 6. Suppose that V1, V2 ER", show that span{v1, v2} is a subspace of Rn.arrow_forwardRa X 2) slots per pole per phase 3/31 180 Ko Sin (1) Kdl 1 sin (4) sin(3) Sin (30) اذا مرید شرح الكتب بس 0 بالفراغ 3) Cos (30) 0.866 4) Rotating 5) Synchronous speed, 120 Fo lasa! G s.1000-950 20:05 1000 Capper losses: 5kw Rotor input lookw 0.05 ined sove in peaper I need a detailed solution on paper please 6) 1 ۳/۱ وه اذا ميريد شرح الكتب فقط look DC 7) rotov Find the general solution of the following equations: +4y=tan2x 3 7357 Find the general solution of the following equations: - Qll y + y (³) = 0. 101arrow_forwardB: 18060 msl Kd Ka, Sin (n) I sin () sin(30) Sin (30) اذا ميريد شرح الكتب بس 0 بالفراغ 3) Cos (30) 0.866 4) Rotating 5) Synchronous speed, 120 x 50 G 5005 1000 s = 1000-950 Copper bosses 5kW /0001 Rotor input 5 : loo kw 0.05 6) 1 اذا ميريد شرح الكتب فقط ١٥٠ 7) rotov DC ined sove in Deaper I need a detailed solution on paper please dy x+2y-4 = dx 2x-y-3 Find the general solution of the following equations: 02//yl-4y+13y=esinarrow_forward
- 1) R₂ = X2 2) slots per pole per phase = 3/31 B msl kd 180 60 Kal Sin (1) I sin () sin(30) Sin (30) اذا ميريد شرح الكتب بس 0 بالفراغ 3) Cos (30) 0.866 4) Rotating 5) Synchronous speed, 120 x 50 G 5005 1000 s = 1000-950 Copper bosses 5kW Rotor input: 5 0.05 loo kw 6) 1 /0001 اذا ميريد شرح الكتب فقط look 7) rotov DC ined sove in peaper I need a detailed solution on paper please Q1// Find the solution of: 'y' = x² +376 x4+316 xyo Q2 Find the solution of the initial-valued problems: ex-y y' +exarrow_forwardR₂ = X2 2) slots per pole per phase = 3/31 B-18060 msl kd Kasi Sin (1) I sin (6) sin(30) Sin (30) اذا ميريد شرح الكتب بس 0 بالفراغ 3) Cos (30) 0.866 4) Rotating 5) Synchronous speed s = 1000-950 1000 Copper losses: 5kw Rotor input 5 0.05 6) 1 120 x 50 G loo kw ined sove in peaper I need a detailed solution on paper please Q3// x²y// +xy/ + (x² - ½) y = x³/². اذا ميريد شرح الكتب فقط look 7) rotor DC Q4// x²y// - (2x+x²)y/ + (2 + x)y = x³. dy 2x+2y+4 = dx 2x-y-3arrow_forward۳/۱ R2X2 2) slots per pole per phase = 3/31 B, 18060 msl Kas Sin() 1sin() sin(30) Sin (30) kd اذا ميريد شرح الكتب بس 0 بالفراغ 3) Cos (30) 0.866 4) Rotating 5) Synchronous speeds S = 1000-950 1000 Copper bosses 5kw 120*50 loca G Rotor input 5 loo kw 6) 1 0.05 اذا ميريد شرح الكتب فقط lookw 7) rotor DC ined sove in peaper I need a detailed solution on paper please 064 Q1// Find the solution of QI/Find the solution of Inxy= 7357 x+2y³ y' = xy3arrow_forward
- R₂ = X2 2) slots per pole per phase 3/31 msl 180 60 Kd Ka Sin (1) Isin (6) sin(30) Sin (30) اذا ميريد شرح الكتب بس 0 بالفراغ 3) Cos (30) 0.866 4) Rotating 5) Synchronous speed, 120*50 1000 6 S = 1000-950 1000 Copper bosses: 5kw Rotor input 5 0.05 : loo kw 6) 1 اذا ميريد شرح الكتب فقط 100 7) rotor DC ined sove in peaper I need a detailed solution on paper please Find the general solution of the following equations: Q2lyl-4y+13y=esinx. Find the general solution of the following equations: " Qly (49) - 16y= 0. 151arrow_forward۳/۱ R₂ = X2 2) slots per pole per phase = 3/31 B-18060 msl kd Kasi Sin (1) I sin (6) sin(30) Sin (30) اذا ميريد شرح الكتب بس 0 بالفراغ 3) Cos (30) 0.866 4) Rotating 5) Synchronous speed s = 1000-950 1000 Copper losses: 5kw Rotor input 5 0.05 6) 1 120 x 50 G loo kw اذا میرید شرح الكتب فقط look 7) rotor DC ined sove in peaper I need a detailed solution on paper dy please 04 12=-cosx.y + 2cosx with y(x) = 1 か 'Oy + xlny + xe")dx + (xsiny + xlnx +*dy=0. 01arrow_forward٣/١ R2X2 2) slots per pole per phase = 3/31 B, 18060 msl kd Kas Sin (1) 1sin() sin(30) Sin (30) اذا ميريد شرح الكتب بس 0 بالفراغ 3) Cos (30) 0.866 4) Rotating 5) Synchronous speeds S = 1000-950 1000 Copper bosses 5kw 120*50 loca G Rotor input 5 loo kw 0.05 6) 1 اذا ميريد شرح الكتب فقط lookw 7) rotor ined sove in peaper I need a detailed solution on paper please DC 口 04 on its wheels as shown in figure. The the door is 8 m below the free surface o is located at the center of the d no water leaks an accident and lands at the bottom of the lake 12m high and I m wide, and the top edge of water Determine the hydrostatic force on the discuss if the driver can open the door, if ong person can lift 100 kg, the passenger The door can be approximated as a vertical rec | 279|-|(23+2+12+20=2) AA Find the general solution of the following equations: 11 - 1/4+xy/-(1-x²³)= 0. 2arrow_forward
- ۳/۱ : +0 العنوان I need a detailed drawing with explanation R₂ = X2 2) slots per pole per phase 3/31 Le msl 180 60 Kd Ka Sin (1) Isin (6) sin(30) Sin (30) اذا ميريد شرح الكتب بس 0 بالفراغ 3) Cos (30) 0.866 4) Rotating 5) Synchronous speed, 120*50 1000 6 S = 1000-950 1000 Copper bosses: 5kw Rotor input 5 loo kw 0.05 6) 1 اذا ميريد شرح الكتب فقط ١٥٠ 7) rotov DC ined sove in peaper I need a detailed solution on paper please 064 Q1// Find the solution of: ( texty Q1// Find the solution of: '' y' -2y= 22% √y³arrow_forwardR2X2 2) slots per pole per phase = 3/31 B-180-60 msl kd Ka, Sin (1) I sin (6) sin(30) Sin (30) اذا ميريد شرح الكتب بس 0 بالفراغ 3) Cos (30) 0.866 4) Rotating 5) Synchronous speed s = 1000-950 1000 Copper losses 5kw 120 50 G Rotor input 5 loo kw 6) 1 ۳/۱ 0.05 إذا ميريد شرح الكتب فقط look 7) rotov DC ined sove in peaper I need a detailed solution on paper please Find the general solution of the following equations: " yll + 4y = tan2x. Find the general solution of the following equations: 01-24+7=0 T el [A] G ха =T Marrow_forwardR₂ = X2 2) slots per pole per phase = 3/31 B-18060 msl kd Kasi Sin (1) I sin (6) sin(30) Sin (30) اذا ميريد شرح الكتب بس 0 بالفراغ 3) Cos (30) 0.866 4) Rotating 5) Synchronous speed s = 1000-950 1000 Copper losses: 5kw Rotor input 5 0.05 6) 1 120 x 50 G loo kw اذا میرید شرح الكتب فقط look 7) rotor DC ined sove in peaper I need a detailed solution on paper please 0 64 Solve the following equations: = dx x²+y2 with y(0) = 1. 7357 Solve the following equations: dy x³+3xy² Q1// = dx 3x²y+y³° 01arrow_forward
- Algebra & Trigonometry with Analytic GeometryAlgebraISBN:9781133382119Author:SwokowskiPublisher:Cengage
 Trigonometry (MindTap Course List)TrigonometryISBN:9781337278461Author:Ron LarsonPublisher:Cengage Learning

 College Algebra (MindTap Course List)AlgebraISBN:9781305652231Author:R. David Gustafson, Jeff HughesPublisher:Cengage Learning
 Functions and Change: A Modeling Approach to Coll...AlgebraISBN:9781337111348Author:Bruce Crauder, Benny Evans, Alan NoellPublisher:Cengage Learning


