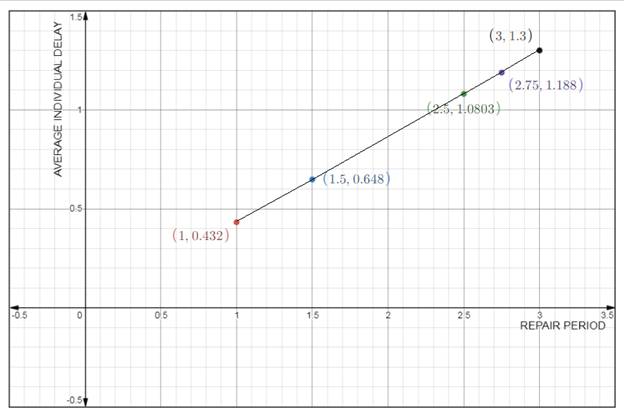
The graph of average individual delay versus the repair period and use this graph to discuss the effect of the expected repair time on the average delay.
Explanation of Solution
Given:
We have been given the following information:
We have been given the following information:
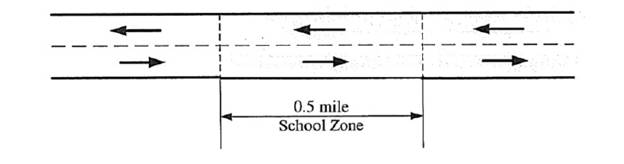
Total number of lanes = 3,
Mean free flow speed of the highway
Jam density
Following is the lay out of the given highway section:
Calculation:For the expected repair period of 1 hour.
We have the following formula for the determination of maximum queue length that will be formed:
Where,
Considering 90 percent of the flow and that the capacity of each lane is 2000 Veh/ h
Substituting the values in the following equation, we have
Themaximum queue length that will be formed is
Now, the total delay, we have the following formula
Where,
And C is the total capacity and can be found as
Now, substituting the values in the required equation, we have
The total delay is
The number of vehicles that will be affected by the incident.
To calculate the number of vehicles that will be affected by the incident can be foundusing the following formula:
Number of vehicles affected =
Substituting the values, we have
The number of vehicles that will be affected by the incident is
To calculate the average individual delay, we have the following formula:
Average individual delay
Substituting the values, we have
The average individual is
For the expected repair period of 1.5 hour.
We have the following formula for the determination of maximum queue length that will be formed:
Where,
Considering 90 percent of the flow and that the capacity of each lane is 2000 Veh/ h
Substituting the values in the following equation, we have
Themaximum queue length that will be formed is
Now, the total delay, we have the following formula
Where,
And C is the total capacity and can be found as
Now, substituting the values in the required equation, we have
The total delay is
The number of vehicles that will be affected by the incident.
To calculate the number of vehicles that will be affected by the incident can be found using the following formula:
Number of vehicles affected =
Substituting the values, we have
The number of vehicles that will be affected by the incident is
To calculate the average individual delay, we have the following formula:
Average individual delay
Substituting the values, we have
Theaverage individualdelay is
For the expected repair period of 2.5 hour.
We have the following formula for the determination of maximum queue length that will be formed:
Where,
Considering 90 percent of the flow and that the capacity of each lane is 2000 Veh/ h
Substituting the values in the following equation, we have
The maximum queue length that will be formed is
Now, the total delay, we have the following formula
Where,
And C is the total capacity and can be found as
Now, substituting the values in the required equation, we have
The total delay is
The number of vehicles that will be affected by the incident.
To calculate the number of vehicles that will be affected by the incident can be found using the following formula:
Number of vehicles affected =
Substituting the values, we have
Therefore, the number of vehicles that will be affected by the incident is
To calculate the average individual delay, we have the following formula:
Average individual delay
Substituting the values, we have
The average individualdelay is
For the expected repair period of 2.75 hour.
We have the following formula for the determination of maximum queue length that will be formed:
Where,
Considering 90 percent of the flow and that the capacity of each lane is 2000 Veh/ h
Substituting the values in the following equation, we have
Therefore, the maximum queue length that will be formed is
Now, the total delay, we have the following formula
Where,
And C is the total capacity and can be found as
Now, substituting the values in the required equation, we have
Therefore, the total delay is
The number of vehicles that will be affected by the incident.
To calculate the number of vehicles that will be affected by the incident can be found using the following formula:
Number of vehicles affected =
Substituting the values, we have
The number of vehicles that will be affected by the incident is
To calculate the average individual delay, we have the following formula:
Average individual delay
Substituting the values, we have
the average individual delay is
For the expected repair period of 3.0 hour.
We have the following formula for the determination of maximum queue length that will be formed:
Where,
Considering 90 percent of the flow and that the capacity of each lane is 2000 Veh/ h
Substituting the values in the following equation, we have
The maximum queue length that will be formed is
Now, the total delay, we have the following formula
Where,
And C is the total capacity and can be found as
Now, substituting the values in the required equation, we have
The total delay is
The number of vehicles that will be affected by the incident.
To calculate the number of vehicles that will be affected by the incident can be found using the following formula:
Number of vehicles affected =
Substituting the values, we have
The number of vehicles that will be affected by the incident is
To calculate the average individual delay, we have the following formula:
Average individual delay
Substituting the values, we have
The average individual delay is
Plot the graph of average individual delay versus the repair period is as follows:
Conclusion:
Therefore, for 1.0 hour : Themaximum queue length that will be formed is
For 1.5hour:
Themaximum queue length that will be formed is
For 2.50hour:
Themaximum queue length that will be formed is
The total delay is
The number of vehicles that will be affected by the incident is
The average individual delayis
For 2.75hour:
Themaximum queue length that will be formed is
The total delay is
The number of vehicles that will be affected by the incident is
The average individual delay is
For 3.0 hour:
Themaximum queue length that will be formed is
The total delay is
The number of vehicles that will be affected by the incident is
The average individual delay is
Want to see more full solutions like this?
Chapter 6 Solutions
Traffic and Highway Engineering - With Mindtap

- A 2.0 m wide strip foundation carries a wall load of 350 kN/m in a clayey soil where y = 17 kN/m³, c' = 5.0 kN/m² and 23°. The foundation depth is 1.5 m. For o' = 23°: Nc = 18.05; N = 8.66; N = 8.20. Determine the factor of safety using the equation below. 1 qu = c' NcFcs Fed Fci +qNqFqs FqdFqi + ½ BN F√s 1 2 (Enter your answer to three significant figures.) s Fyd Fi FS =arrow_forward1.2 m BX B 70 kN.m y = 16 kN/m³ c' = 0 6'-30° Water table Ysat 19 kN/m³ c' 0 &' = 30° A square foundation is shown in the figure above. Use FS = 6, and determine the size of the foundation. Use the Prakash and Saran theory (see equation and figures below). Suppose that F = 450 kN. Qu = BL BL[c′Nc(e)Fcs(e) + qNg(e)Fcs(e) + · 1 YBN(e) F 2 7(e) Fra(e)] (Enter your answer to two significant figures.) B: m Na(e) 60 40- 20- e/B=0 0.1 0.2 0.3 .0.4 0 0 10 20 30 40 Friction angle, ' (deg) Figure 1 Variation of Na(e) with o' Ny(e) 60 40 20 e/B=0 0.3 0.1 0.2 0.4 0 0 10 20 30 40 Friction angle, ' (deg) Figure 2 Variation of Nye) with o'arrow_forwardK/S 46. (O المهمات الجديدة 0 المنتهية 12 المغـ ۱۱:۰۹ search ليس لديك اي مهمات ☐ ○ ☑arrow_forward
- I need help setti if this problem up and solving. I keep doing something wrong.arrow_forward1.0 m (Eccentricity in one direction only)=0.15 m Call 1.5 m x 1.5m Centerline An eccentrically loaded foundation is shown in the figure above. Use FS of 4 and determine the maximum allowable load that the foundation can carry if y = 18 kN/m³ and ' = 35°. Use Meyerhof's effective area method. For '=35°, N = 33.30 and Ny = 48.03. (Enter your answer to three significant figures.) Qall = kNarrow_forwardWhat are some advantages and disadvantages of using prefabrication in construction to improve efficiency and cut down on delays?arrow_forward
- PROBLEM:7–23. Determine the maximum shear stress acting in the beam at the critical section where the internal shear force is maximum. 3 kip/ft ΑΟ 6 ft DiC 0.75 in. 6 ft 6 in. 1 in. F [ 4 in. C 4 in. D 6 in. Fig of prob:7-23 1 in. 6 ft Barrow_forward7.60 This abrupt expansion is to be used to dissipate the high-energy flow of water in the 5-ft-diameter penstock. Assume α = 1.0 at all locations. a. What power (in horsepower) is lost through the expansion? b. If the pressure at section 1 is 5 psig, what is the pressure at section 2? c. What force is needed to hold the expansion in place? 5 ft V = 25 ft/s Problem 7.60 (2) 10 ftarrow_forward7.69 Assume that the head loss in the pipe is given by h₁ = 0.014(L/D) (V²/2g), where L is the length of pipe and D is the pipe diameter. Assume α = 1.0 at all locations. a. Determine the discharge of water through this system. b. Draw the HGL and the EGL for the system. c. Locate the point of maximum pressure. d. Locate the point of minimum pressure. e. Calculate the maximum and minimum pressures in the system. Elevation 100 m Water T = 10°C L = 100 m D = 60 cm Elevation 95 m Elevation 100 m L = 400 m D = 60 cm Elevation = 30 m Nozzle 30 cm diameter jet Problem 7.69arrow_forward
- A rectangular flume of planed timber (n=0.012) slopes 0.5 ft per 1000 ft. (i)Compute the discharge if the width is 7 ft and the depth of water is 3.5 ft. (ii) What would be thedischarge if the width were 3.5 ft and depth of water is 7 ft? (iii) Which of the two forms wouldhave greater capacity and which would require less lumber?arrow_forwardFigure shows a tunnel section on the Colorado River Aqueduct. The area of the water cross section is 191 ft 2 , and the wetted perimeter is 39.1 ft. The flow is 1600 cfs. If n=0.013 for the concrete lining, find the slope.arrow_forward7.48 An engineer is making an estimate for a home owner. This owner has a small stream (Q= 1.4 cfs, T = 40°F) that is located at an elevation H = 34 ft above the owner's residence. The owner is proposing to dam the stream, diverting the flow through a pipe (penstock). This flow will spin a hydraulic turbine, which in turn will drive a generator to produce electrical power. Estimate the maximum power in kilowatts that can be generated if there is no head loss and both the turbine and generator are 100% efficient. Also, estimate the power if the head loss is 5.5 ft, the turbine is 70% efficient, and the generator is 90% efficient. Penstock Turbine and generator Problem 7.48arrow_forward
 Traffic and Highway EngineeringCivil EngineeringISBN:9781305156241Author:Garber, Nicholas J.Publisher:Cengage Learning
 Engineering Fundamentals: An Introduction to Engi...Civil EngineeringISBN:9781305084766Author:Saeed MoaveniPublisher:Cengage Learning
 Solid Waste EngineeringCivil EngineeringISBN:9781305635203Author:Worrell, William A.Publisher:Cengage Learning,
 Residential Construction Academy: House Wiring (M...Civil EngineeringISBN:9781285852225Author:Gregory W FletcherPublisher:Cengage Learning