
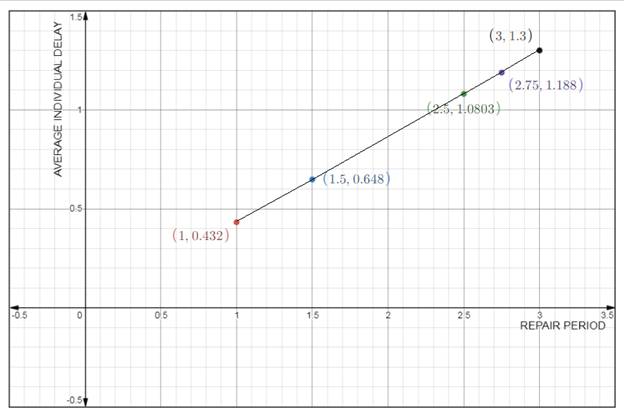
The graph of average individual delay versus the repair period and use this graph to discuss the effect of the expected repair time on the average delay.
Explanation of Solution
Given:
We have been given the following information:
We have been given the following information:
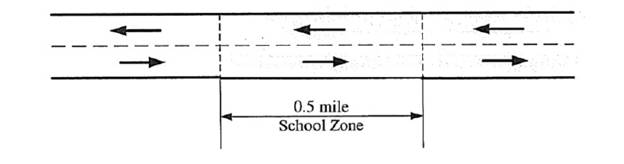
Total number of lanes = 3,
Mean free flow speed of the highway
Jam density
Following is the lay out of the given highway section:
Calculation:For the expected repair period of 1 hour.
We have the following formula for the determination of maximum queue length that will be formed:
Where,
Considering 90 percent of the flow and that the capacity of each lane is 2000 Veh/ h
Substituting the values in the following equation, we have
Themaximum queue length that will be formed is
Now, the total delay, we have the following formula
Where,
And C is the total capacity and can be found as
Now, substituting the values in the required equation, we have
The total delay is
The number of vehicles that will be affected by the incident.
To calculate the number of vehicles that will be affected by the incident can be foundusing the following formula:
Number of vehicles affected =
Substituting the values, we have
The number of vehicles that will be affected by the incident is
To calculate the average individual delay, we have the following formula:
Average individual delay
Substituting the values, we have
The average individual is
For the expected repair period of 1.5 hour.
We have the following formula for the determination of maximum queue length that will be formed:
Where,
Considering 90 percent of the flow and that the capacity of each lane is 2000 Veh/ h
Substituting the values in the following equation, we have
Themaximum queue length that will be formed is
Now, the total delay, we have the following formula
Where,
And C is the total capacity and can be found as
Now, substituting the values in the required equation, we have
The total delay is
The number of vehicles that will be affected by the incident.
To calculate the number of vehicles that will be affected by the incident can be found using the following formula:
Number of vehicles affected =
Substituting the values, we have
The number of vehicles that will be affected by the incident is
To calculate the average individual delay, we have the following formula:
Average individual delay
Substituting the values, we have
Theaverage individualdelay is
For the expected repair period of 2.5 hour.
We have the following formula for the determination of maximum queue length that will be formed:
Where,
Considering 90 percent of the flow and that the capacity of each lane is 2000 Veh/ h
Substituting the values in the following equation, we have
The maximum queue length that will be formed is
Now, the total delay, we have the following formula
Where,
And C is the total capacity and can be found as
Now, substituting the values in the required equation, we have
The total delay is
The number of vehicles that will be affected by the incident.
To calculate the number of vehicles that will be affected by the incident can be found using the following formula:
Number of vehicles affected =
Substituting the values, we have
Therefore, the number of vehicles that will be affected by the incident is
To calculate the average individual delay, we have the following formula:
Average individual delay
Substituting the values, we have
The average individualdelay is
For the expected repair period of 2.75 hour.
We have the following formula for the determination of maximum queue length that will be formed:
Where,
Considering 90 percent of the flow and that the capacity of each lane is 2000 Veh/ h
Substituting the values in the following equation, we have
Therefore, the maximum queue length that will be formed is
Now, the total delay, we have the following formula
Where,
And C is the total capacity and can be found as
Now, substituting the values in the required equation, we have
Therefore, the total delay is
The number of vehicles that will be affected by the incident.
To calculate the number of vehicles that will be affected by the incident can be found using the following formula:
Number of vehicles affected =
Substituting the values, we have
The number of vehicles that will be affected by the incident is
To calculate the average individual delay, we have the following formula:
Average individual delay
Substituting the values, we have
the average individual delay is
For the expected repair period of 3.0 hour.
We have the following formula for the determination of maximum queue length that will be formed:
Where,
Considering 90 percent of the flow and that the capacity of each lane is 2000 Veh/ h
Substituting the values in the following equation, we have
The maximum queue length that will be formed is
Now, the total delay, we have the following formula
Where,
And C is the total capacity and can be found as
Now, substituting the values in the required equation, we have
The total delay is
The number of vehicles that will be affected by the incident.
To calculate the number of vehicles that will be affected by the incident can be found using the following formula:
Number of vehicles affected =
Substituting the values, we have
The number of vehicles that will be affected by the incident is
To calculate the average individual delay, we have the following formula:
Average individual delay
Substituting the values, we have
The average individual delay is
Plot the graph of average individual delay versus the repair period is as follows:
Conclusion:
Therefore, for 1.0 hour : Themaximum queue length that will be formed is
For 1.5hour:
Themaximum queue length that will be formed is
For 2.50hour:
Themaximum queue length that will be formed is
The total delay is
The number of vehicles that will be affected by the incident is
The average individual delayis
For 2.75hour:
Themaximum queue length that will be formed is
The total delay is
The number of vehicles that will be affected by the incident is
The average individual delay is
For 3.0 hour:
Themaximum queue length that will be formed is
The total delay is
The number of vehicles that will be affected by the incident is
The average individual delay is
Want to see more full solutions like this?
Chapter 6 Solutions
Traffic And Highway Engineering

- a) Calculate the BMs (bending moments) at all the joints of the beam shown in Figure below using the moment distribution method. The beam is subjected to an UDL of w kN/m. L1= 0.4L. Assume the support at C is pinned, and A and B are roller supports. E = 200 GPa, I = 250x10^6 mm4. Use the values of w and L as 50kN/m and 5m respectively. b) Draw the shear force and bending diagrams for the entire beam. c) Calculate the BMs at all the joints of the same beam shown in Figure using the slope deflection method. d) Compare the values of BMs obtained using the two methods a) and c) and comment.arrow_forwardThe interior floor beam shown below at 3-year service life according to the ACI Code, supports partitions,etc. Maximum service load moments are 38 kip-ft dead load and 29 kip-ft live load. Assume that 50% ofthe live load is sustained. Use fc′ = 5000 psi, fy = 75,000 psi.a. Determine if the minimum deflection criteria from ACI is satisfied.b. Find the effective moment of inertia.c. Find the maximum instantaneous and long-term defecations.d. Check if the deflections are within ACI allowable limitsarrow_forwarda) For the truss shown in the figure below, determine the stiffness matrices of elements 2, 3 and 4 in the in the global co-ordinate system. Assume for each member A = 0.0015 m2 and E = 200 GPa. Indicate the degrees-of freedom in all the stiffness matrices. b) Determine the stiffness matrix of the whole truss in the global co-ordinate system. Clearly indicate the degrees-of freedom numbers in the stiffness matrix. c) Calculate all the nodal displacements and all the member forces of the truss.arrow_forward
- a) Draw a 2D element and show the dofs (degrees of freedom). Draw all the 2D elements used in Strand7. Explain the differences between these elements in terms of the no. of nodes and interpolation/shape functions used. b) A 8 m x 8 m plate (in the xy plane) with 8 mm thickness, is fixed at all the edges and is loaded by a pressure loading of 4 kN/m2 in the downward (-z) direction. The plate is made of steel (E = 200 GPa, density = 7850 kg/m3). Explain the steps involved in setting up a Strand7 model for this problem. Your explanation should include how the given input data for this problem will be used in Strand7 modelling. Explain how you would determine the maximum deflection from the Strand7 output.arrow_forwardFor the truss shown in Fig 2, determine the nodal displacement and member forces using the stifness method for all elements of the truss. Assume for each member A = 0.0015 m2 and E = 200 GPaarrow_forward5. Two 400 g blocks are connected by a rigid rod. The Blocks can rotate freely at the ends of the rod, so the rod does not apply any moments to the blocks. The blocks are in contact with the wall and floor, and can slide without friction. The system is released from rest when X=24cm and Y=18cm. Ignore the mass of the rod. What are the initial accelerations of Block A and Block B just after being released? Hint: See Assignment 4, Problem 2 for help getting a relationship between the acceleration of Block A and the acceleration of Block B. Y m = 400 g A | L g I 1 I I X B m = 400 garrow_forward
- The momentum of the force F = -100 i -70 j + 50 k around the point O is MO = 410 i- 300 j + 400 k, Determine the coordinates of the point through which the line of actionof F intercepts the yz plane.arrow_forwardAverage sludge production reported by members of the National Association of Clean Water Agencies is 0.7 tons of sludge TS per MG wastewater treated. Assume that the organic matter (VS) in the sludge contains 10% N and that the ratio of VS/TS in sludge is 0.85. A) How many mg/L of N are removed from the wastewater due to assimilation? B) If the raw wastewater contained 50 mg/L total N, what percent was removed via assimilation? C) Why is this a disappointing result in terms of nutrient recovery and reuse goals?arrow_forwardThe two-part curve is from a BOD bottle test conducted over 50 days (i.e., ultimate UBOD). The nitrifying bacteria numbers grew to significance by Day-8.There is a lower cBOD curve and an upper nBOD curve. BOD₁ = UBOD (1− e−k₁t) A) What is the rate constants k for cBOD? B) What is the rate constants k for nBOD? C) Why aren't nitrifiers prevalent in the raw wastewater? Treatment ponds have long hydraulic residence times (HRTs), so nitrifiers are a significant part of the microbiome. D) Sketch a 50-d BOD curve similar to the above, but for a pond effluent sample. The sum of the c and n BODs at 50 days is 30 mg/L. E) Why does your curve have the shape you give it? 100 80 BOD, mg/L 60 60 40 40 20 20 0 0 10 20 30 40 40 Time, d 50 60arrow_forward
- 6-19 Determine the LRFD design strength and the ASD allowable strength of the section shown if snug-tight bolts 3 ft on center are used to connect the A572-Grade 50 angles. The two angles, 5×31/2 × 5/16, are oriented with the long legs back-to-back (2 L5 × 31/2 × 5/16 LLBB) and separated by 3/8 inch. The effective length, (Lc)x = (Lc)y = (Lc)z = 14 ft. (Ans. 65.4 k LRFD; 43.5 k ASD) Figure P6-19 x x 2L5×32×5/16 LLBBarrow_forward6-21 Four 3×3× 1/4 angles are used to form the member shown in the accompanying illustration. The member is 24 ft long, has pinned ends, and consists of A572-Grade 50 steel. Determine the LRFD design strength and the ASD allowable strength of the member. Design single lacing and end tie plates, assuming connections are made to the angles with 3/4-in diameter bolts. (Ans. 159.1 k LRFD; 106.0 k ASD) Figure P6-21 12 in L 12 inarrow_forward1000 th 2' 2' w=200 to /ft Handout Problem #3. A beam has the loading and cross section shown. 1) Draw the shear force and bending moment diagrams for the beam. 5" 2) Determine the maximum bending stress in the beam. Carefully identify its location both along the beam and along the cross section. 3) Determine the maximum transverse shear stress in the beam. Carefully identify its location both along the beam and along the cross section: y=2" up from bottom "INA = 33.33 int VMAX = 1160+b MMAX - 2704 Hb-ft QMAX = 8mm³arrow_forward
 Traffic and Highway EngineeringCivil EngineeringISBN:9781305156241Author:Garber, Nicholas J.Publisher:Cengage Learning
 Engineering Fundamentals: An Introduction to Engi...Civil EngineeringISBN:9781305084766Author:Saeed MoaveniPublisher:Cengage Learning
 Solid Waste EngineeringCivil EngineeringISBN:9781305635203Author:Worrell, William A.Publisher:Cengage Learning,
 Residential Construction Academy: House Wiring (M...Civil EngineeringISBN:9781285852225Author:Gregory W FletcherPublisher:Cengage Learning