
Videos
(a)
Find which one is the biggest area among the two areas or check whether the two areas or equal or not.
(a)
Answer to Problem 19CAP
The area above the
Explanation of Solution
Calculation:
The given information is that the set of data is distributed normally with mean 3.5 and standard deviation 0.6.
Assume that the random variable X belongs to the set of the data.
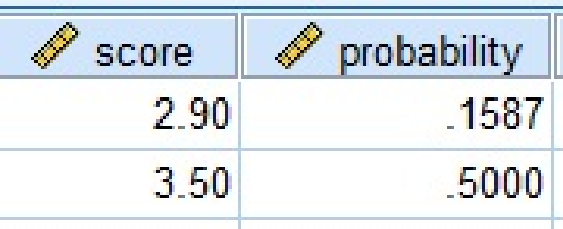
The area below the mean is,
Software procedure:
Step by step procedure to obtain the probability by using SPSS software as follows:
- Go to Variable View, enter the variable name as Score and make Decimals column as 4.
- Go to Data View, enter the value in score column as 3.5.
- Go to Transform tab, choose Compute Variables.
- Enter Target variable as probabilty.
- Choose CDF &non-central CDF from the function group then select Cdf.Normal from the
functions . - In Numeric Expression CDF.NORMAL (pro, mean, stddev), choose the first variable as Scores from the left side tab, enter second variable as 3.5 and third variable as 0.6.
- Click on OK.
Output using SPSS software is given as follows:
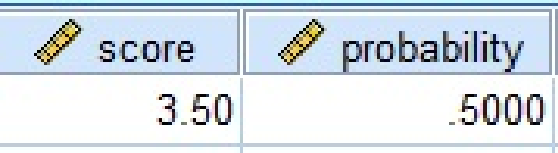
From the output, the value of
The area below the mean is 0.5000.
The area above the mean is,
The area above the mean is 0.5000.
Thus, the area above the mean and the area below the mean is same.
(b)
Find which one is the biggest area among the two areas or check whether the two areas or equal or not.
(b)
Answer to Problem 19CAP
The area between the value of 2.9 and 4.1 is higher than the area between the values of 3.5 and 4.7.
Explanation of Solution
Calculation:
The area between the values 2.9 and 4.1 is,
Software procedure:
Step by step procedure to obtain the probability by using SPSS software as follows:
- Go to Variable View, enter the variable name as Score.
- Go to Data View, enter the value in score column as 4.1 and 2.9.
- Go to Transform tab, choose Compute Variables.
- Enter Target variable as probabilty.
- Choose CDF &non-central CDF from the function group then select Cdf.Normal from the functions.
- In Numeric Expression CDF.NORMAL (pro, mean, stddev), choose the first variable as Score from the left side tab, enter second variable as 3.5 and third variable as 0.6.
- Click on OK.
Output using SPSS software is given as follows:
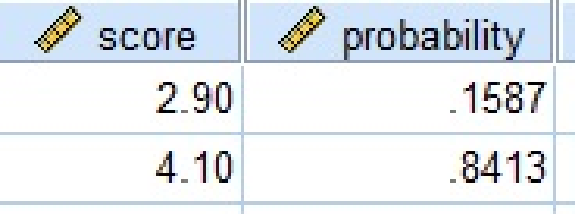
From the output, the value of
The area between the values of 2.9 and 4.1 is,
The area between the values of 2.9 and 4.1 is 0.6826.
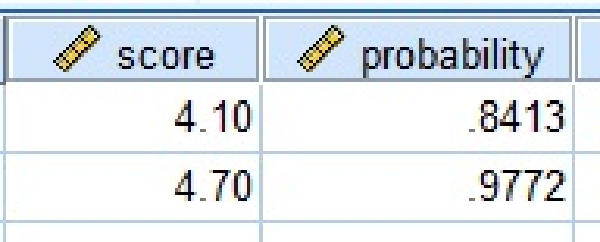
The area between the values 3.5 and 4.7 is,
Software procedure:
Step by step procedure to obtain the probability by using SPSS software as follows:
- Go to Variable View, enter the variable name as Score.
- Go to Data View, enter the value in score column as 3.5 and 4.7.
- Go to Transform tab, choose Compute Variables.
- Enter Target variable as probabilty.
- Choose CDF &non-central CDF from the function group then select Cdf.Normal from the functions.
- In Numeric Expression CDF.NORMAL (pro, mean, stddev), choose the first variable as Score from the left side tab, enter second variable as 3.5 and third variable as 0.6.
- Click on OK.
Output using SPSS software is given as follows:
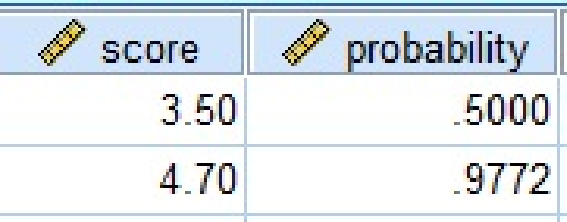
From the output, the value of
The area between the values of 3.5 and 4.7 is,
The area between the values of 3.5 and 4.7 is 0.4772.
Thus, the area between the value of 2.9 and 4.1 is higher than the area between the values of 3.5 and 4.7.
(c)
Find which one is the biggest area among the two areas or check whether the two areas or equal or not.
(c)
Answer to Problem 19CAP
The area between the value mean and 3.5 is lower than the area above the value 5.3.
Explanation of Solution
Calculation:
The value of the mean is 3.5.
The area between the values mean and 3.5 is,
The area between the values of mean and 3.5 is 0.
The area above the value 5.3 is,
Software procedure:
Step by step procedure to obtain the probability by using SPSS software as follows:
- Go to Variable View, enter the variable name as Score.
- Go to Data View, enter the value in score column as 5.3.
- Go to Transform tab, choose Compute Variables.
- Enter Target variable as probabilty.
- Choose CDF &non-central CDF from the function group then select Cdf.Normal from the functions.
- In Numeric Expression CDF.NORMAL (pro, mean, stddev), choose the first variable as Score from the left side tab, enter second variable as 3.5 and third variable as 0.6.
- Click on OK.
Output using SPSS software is given as follows:
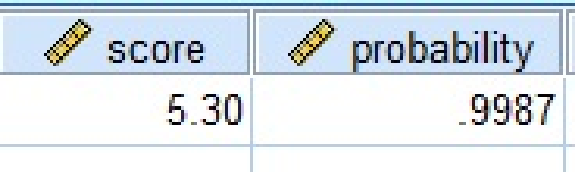
From the output, the value of
The area above 5.3 is,
The area above the value 5.3 is 0.0013.
Thus, the area between the value mean and 3.5 is lower than the area above the value 5.3.
(d)
Find which one is the biggest area among the two areas or check whether the two areas or equal or not.
(d)
Answer to Problem 19CAP
The area below 3.6 is equal to the area above 3.4.
Explanation of Solution
Calculation:
The area below 3.6 is,
Software procedure:
Step by step procedure to obtain the probability by using SPSS software as follows:
- Go to Variable View, enter the variable name as Score.
- Go to Data View, enter the value in score column as 3.6.
- Go to Transform tab, choose Compute Variables.
- Enter Target variable as probabilty.
- Choose CDF &non-central CDF from the function group then select Cdf.Normal from the functions.
- In Numeric Expression CDF.NORMAL (pro, mean, stddev), choose the first variable as Score from the left side tab, enter second variable as 3.5 and third variable as 0.6.
- Click on OK.
Output using SPSS software is given as follows:
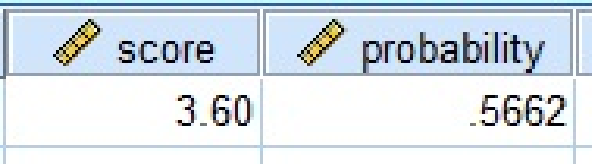
From the output, the value of
The area below 3.6 is 0.5662.
The area above 3.4 is,
Software procedure:
Step by step procedure to obtain the probability by using SPSS software as follows:
- Go to Variable View, enter the variable name as Score.
- Go to Data View, enter the value in score column as 3.4.
- Go to Transform tab, choose Compute Variables.
- Enter Target variable as probabilty.
- Choose CDF &non-central CDF from the function group then select Cdf.Normal from the functions.
- In Numeric Expression CDF.NORMAL (pro, mean, stddev), choose the first variable as Score from the left side tab, enter second variable as 3.5 and third variable as 0.6.
- Click on OK.
Output using SPSS software is given as follows:
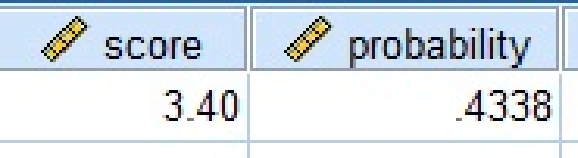
From the output, the value of
The area above 3.4 is,
The area above 3.4 is 0.5662.
Thus, the area below 3.6 is equal to the area above 3.4.
(e)
Find which one is the biggest area among the two areas or check whether the two areas or equal or not.
(e)
Answer to Problem 19CAP
The area between the 4.1 and 4.7 is lower than the area between the 2.9 and 3.5.
Explanation of Solution
Calculation:
The area between 4.1 and 4.7 is,
Software procedure:
Step by step procedure to obtain the probability by using SPSS software as follows:
- Go to Variable View, enter the variable name as Score.
- Go to Data View, enter the value in score column as 4.1 and 4.7.
- Go to Transform tab, choose Compute Variables.
- Enter Target variable as probabilty.
- Choose CDF &non-central CDF from the function group then select Cdf.Normal from the functions.
- In Numeric Expression CDF.NORMAL (pro, mean, stddev), choose the first variable as Score from the left side tab, enter second variable as 3.5 and third variable as 0.6.
- Click on OK.
Output using SPSS software is given as follows:
From the output, the value of
The area between 4.1 and 4.7 is 0.1359.
The area between 2.9 and 3.5 is,
Software procedure:
Step by step procedure to obtain the probability by using SPSS software as follows:
- Go to Variable View, enter the variable name as Score.
- Go to Data View, enter the value in score column as 2.9 and 3.5.
- Go to Transform tab, choose Compute Variables.
- Enter Target variable as probabilty.
- Choose CDF &non-central CDF from the function group then select Cdf.Normal from the functions.
- In Numeric Expression CDF.NORMAL (pro, mean, stddev), choose the first variable as Score from the left side tab, enter second variable as 3.5 and third variable as 0.6.
- Click on OK.
Output using SPSS software is given as follows:
From the output, the value of
The area between 2.9 and 3.5 is 0.3413.
Thus, the area between the 4.1 and 4.7 is lower than the area between the 2.9 and 3.5.
Want to see more full solutions like this?
Chapter 6 Solutions
Statistics for the Behavioral Sciences


- To evaluate the success of a 1-year experimental program designed to increase the mathematical achievement of underprivileged high school seniors, a random sample of participants in the program will be selected and their mathematics scores will be compared with the previous year’s statewide average of 525 for underprivileged seniors. The researchers want to determine whether the experimental program has increased the mean achievement level over the previous year’s statewide average. If alpha=.05, what sample size is needed to have a probability of Type II error of at most .025 if the actual mean is increased to 550? From previous results, sigma=80.arrow_forwardPlease help me answer the following questions from this problem.arrow_forwardPlease help me find the sample variance for this question.arrow_forward
- Crumbs Cookies was interested in seeing if there was an association between cookie flavor and whether or not there was frosting. Given are the results of the last week's orders. Frosting No Frosting Total Sugar Cookie 50 Red Velvet 66 136 Chocolate Chip 58 Total 220 400 Which category has the greatest joint frequency? Chocolate chip cookies with frosting Sugar cookies with no frosting Chocolate chip cookies Cookies with frostingarrow_forwardThe table given shows the length, in feet, of dolphins at an aquarium. 7 15 10 18 18 15 9 22 Are there any outliers in the data? There is an outlier at 22 feet. There is an outlier at 7 feet. There are outliers at 7 and 22 feet. There are no outliers.arrow_forwardStart by summarizing the key events in a clear and persuasive manner on the article Endrikat, J., Guenther, T. W., & Titus, R. (2020). Consequences of Strategic Performance Measurement Systems: A Meta-Analytic Review. Journal of Management Accounting Research?arrow_forward
- The table below was compiled for a middle school from the 2003 English/Language Arts PACT exam. Grade 6 7 8 Below Basic 60 62 76 Basic 87 134 140 Proficient 87 102 100 Advanced 42 24 21 Partition the likelihood ratio test statistic into 6 independent 1 df components. What conclusions can you draw from these components?arrow_forwardWhat is the value of the maximum likelihood estimate, θ, of θ based on these data? Justify your answer. What does the value of θ suggest about the value of θ for this biased die compared with the value of θ associated with a fair, unbiased, die?arrow_forwardShow that L′(θ) = Cθ394(1 −2θ)604(395 −2000θ).arrow_forward
 Glencoe Algebra 1, Student Edition, 9780079039897...AlgebraISBN:9780079039897Author:CarterPublisher:McGraw Hill
 Big Ideas Math A Bridge To Success Algebra 1: Stu...AlgebraISBN:9781680331141Author:HOUGHTON MIFFLIN HARCOURTPublisher:Houghton Mifflin Harcourt