Concept explainers
a.
To identify: The interest on Treasury securities, and yield curve.
Yield:
Yield is the percentage of securities at which the return is provided by the company to its investors. Yield can be there in the form of dividend and interest.
Yield Curve:
The graphical representation of the expected return, provided by the company to its investors during the years is known as the yield curve.
a.
Answer to Problem 18P
The items required for the calculation of interest rate are the real risk-free rate, inflation rate, and maturity risk premium.
Explanation of Solution
Given,
The risk free rate is 2% or 0.02.
Inflation rate for the first year is 7% or 0.07.
The inflation rate of second year is 5% or 0.05.
The inflation rate after two years is 3% or 0.03.
The maturity risk premium for the first year is 0.2% or 0.002 and it will increase by 0.2% every year till 1%.
Formula to calculate the interest rate,
Where,
- r is the corporate bond yield.
- r* is the risk free rate.
- IP is the inflation premium.
- MRP is the maturity risk premium.
Statement to show the calculation of interest rate
| Maturity |
Real Risk-Free Rate (%) (r*) |
Inflation Rate (%) (IP) |
Maturity Risk Premium (MRP) |
Interest Rate on Treasury Bond
|
| 1 | 2 | 7 | 0.2 | 9.20 |
| 2 | 2 | 5 | 0.4 | 7.40 |
| 3 | 2 | 3 | 0.6 | 5.60 |
| 4 | 2 | 3 | 0.8 | 5.80 |
| 5 | 2 | 3 | 1 | 6 |
| 10 | 2 | 3 | 1 | 6 |
| 20 | 2 | 3 | 1 | 6 |
Table (1)
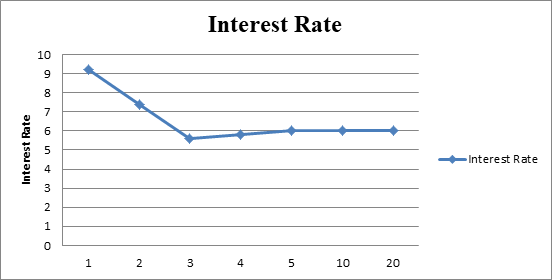
The yield curve of the given data

Fig 1
- The x-axis represents the maturity.
- The y-axis represents the interest rate.
- The interest rates with their respective time period can be shown from the graph.
Hence, the interest of 1-year treasury securities is 9.20%, at 2-year treasury securities is 7.60%, 3-year treasury securities is 5.60%, 4-year treasury securities is 5.80% and thereafter is 6%.
b.
To identify: The interest rate on AAA rated securities, and the yield curve.
b.
Answer to Problem 18P
The items required for the calculation of interest rate are real risk-free rate, inflation rate, and maturity risk premium.
Explanation of Solution
Explanation:
Given,
The risk free rate is 2% or 0.02.
Inflation rate for the first year is 7% or 0.07.
The inflation rate of second year is 5% or 0.05.
The inflation rate after two years is 3% or 0.03.
The maturity risk premium for the first year is 0.2% or 0.002 and it will increase by 0.2% every year till 1%.
The default risk premium is 1% which increases
Formula to calculate the interest rate,
Where,
- r is the corporate bond yield.
- r* is the risk free rate.
- IP is the inflation premium.
- MRP is the maturity risk premium.
- DRP is the default risk premium.
Statement to show the calculation of interest rate
| Maturity |
Real Risk-Free Rate (%) (r*) |
Inflation Rate on Treasury Bond (%) (IP) |
Maturity Risk Premium (%) (MRP) |
Interest Rate on Treasury Bond
|
Default Risk Premium (%) (DRP) |
Interest Rate on AAA rated Bonds
|
| 1 | 2 | 7 | 0.2 | 9.20 | 1 | 10.20 |
| 2 | 2 | 5 | 0.4 | 7.40 | 2 | 9.40 |
| 3 | 2 | 3 | 0.6 | 5.60 | 2 | 7.60 |
| 4 | 2 | 3 | 0.8 | 5.80 | 3 | 8.80 |
| 5 | 2 | 3 | 1 | 6 | 4 | 10 |
| 10 | 2 | 3 | 1 | 6 | 5 | 11 |
| 20 | 2 | 3 | 1 | 6 | 5 | 11 |
Table (2)
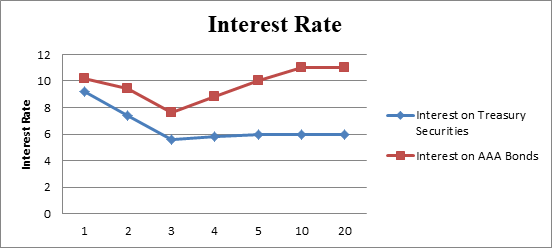
The yield curve of the given data

Fig 2
- The x-axis represents the maturity.
- The y-axis represents the interest rate.
- The interest rates of treasury securities and AAA bonds with their respective time period can be shown from the graph.
Hence, the interest of 1-year AAA bond is 10.20%, at 2-year AAA bond is 9.40%, 3-year AAA bond is 7.60%, 4-year AAA bond is 8.80% 5-year AAA bond is 10% and thereafter it is 11%.
c.
To identify: The interest rate on lower rated bonds, and the yield curve.
c.
Answer to Problem 18P
The items required for the calculation of interest rate are the inflation rate, real risk-free rate, and maturity risk premium.
Explanation of Solution
Given,
The risk free rate is 2% or 0.02.
Inflation rate for the first year is 7% or 0.07.
The inflation rate of second year is 5% or 0.05.
The inflation rate after two years is 3% or 0.03.
The maturity risk premium for the first year is 0.2% or 0.002 and it will increase by 0.2% every year till 1%.
The default risk premium is 1% which increases
Formula to calculate the interest rate,
Where,
- r is the corporate bond yield.
- r* is the risk free rate.
- IP is the inflation premium.
- MRP is the maturity risk premium.
- DRP is the default risk premium.
Statement to show the calculation of interest rate on AAA rated bonds
| Maturity |
Real Risk-Free Rate (%) (r*) |
Inflation Rate on Treasury Bond (%) (IP) |
Maturity Risk Premium (%) (MRP) |
Default Risk Premium (%) (DRP) |
Interest Rate
|
| 1 | 2 | 7 | 0.2 | 1 | 10.20 |
| 2 | 2 | 5 | 0.4 | 2 | 9.40 |
| 3 | 2 | 3 | 0.6 | 2 | 7.60 |
| 4 | 2 | 3 | 0.8 | 3 | 8.80 |
| 5 | 2 | 3 | 1 | 4 | 10 |
| 10 | 2 | 3 | 1 | 5 | 11 |
| 20 | 2 | 3 | 1 | 5 | 11 |
Table (3)
Statement to show the calculation of interest rate on lower rated bonds
| Maturity |
Real Risk-Free Rate (%) (r*) |
Inflation Rate on Treasury Bond (%) (IP) |
Maturity Risk Premium (%) (MRP) |
Default Risk Premium on Lower rated Bonds (%) (DRP) |
Interest Rate (%)
|
| 1 | 2 | 7 | 0.2 | 2 | 11.2 |
| 2 | 2 | 5 | 0.4 | 3 | 10.40 |
| 3 | 2 | 3 | 0.6 | 4 | 9.60 |
| 4 | 2 | 3 | 0.8 | 5 | 10.80 |
| 5 | 2 | 3 | 1 | 5 | 11 |
| 10 | 2 | 3 | 1 | 6 | 12 |
| 20 | 2 | 3 | 1 | 7 | 13 |
Table (4)
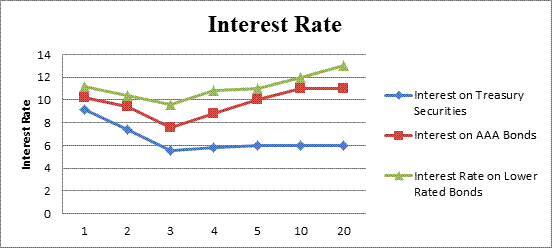
The yield curve of the given data

Fig 2
- The x-axis represents the maturity.
- The y-axis represents the interest rate.
- The interest rates of Treasury securities, AAA bonds and lower rated bonds with their respective time period can be shown from the graph.
Hence, the interest of 1-year lower rated bond is 11.20%, at 2-year lower rated bond is 10.40%, 3-year lower rated bond is 9.60%, 4-year lower rated bond is 10.80% 5-year lower rated bond is 11%, 10-year lower rated bond is 12% and thereafter is 13%.
Want to see more full solutions like this?
Chapter 6 Solutions
Fundamentals of Financial Management (MindTap Course List)
- Single-payment loan repayment Personal Finance Problem A person borrows $280 that he must repay in a lump sum no more than 8 years from now. The interest rate is 7.7% annually compounded. The borrower can repay the loan at the end of any earlier year with no prepayment penalty. a. What amount will be due if the borrower repays the loan after 2 year? b. How much would the borrower have to repay after 4 years? c. What amount is due at the end of the eighth year? a. The amount due if the loan is repaid at the end of year 2 is $ (Round to the nearest cent.) b. The repayment at the end of year 4 is $ (Round to the nearest cent.) c. The amount due at the end of the eighth year is $ (Round to the nearest cent.)arrow_forwardGrowth rates Jamie El-Erian is a savvy investor. On January 1, 2010, she bought shares of stock in Amazon, Chipotle Mexican Grill, and Netflix. The table, , shows the price she paid for each stock, the price she received when she eventually sold her shares, and the date on which she sold each stock. Calculate the average annual growth in each company's share price over the time that Jamie held its stock. The average annual growth for Amazon is The average annual growth for Chipotle is The average annual growth for Netflix is %. (Round to two decimal places.) %. (Round to two decimal places.) %. (Round to two decimal places.)arrow_forwardYour portfolio has three asset classes. U.S. government T-bills account for 48% of the portfolio, large-company stocks constitute another 33%, and small-company stocks make up the remaining 19%. If the expected returns are 4.71% for the T-bills, 14.13% for the large-company stocks, and 19.85% for the small-company stocks, what is the expected return of the portfolio? The expected return of the portfolio is %. (Round to two decimal places.)arrow_forward
- betas: A, 0.4 B, 1.5 C, -0.4 D, 1.7arrow_forwardIntegrative―Risk, return, and CAPM Wolff Enterprises must consider one investment project using the capital asset pricing model (CAPM). Relevant information is presented in the following table. (Click on the icon here in order to copy the contents of the data table below into a spreadsheet.) Item Risk-free asset Market portfolio Project 4% Rate of return Beta, b 0.00 12% 1.00 1.28 a. Calculate the required rate of return for the project, given its level of nondiversifiable risk. b. Calculate the risk premium for the project, given its level of nondiverisifiable risk. a. The required rate of return for the project is %. (Round to two decimal places.) b. The risk premium for the project is %. (Round to two decimal places.)arrow_forwardSecurity market line (SML) Assume that the risk-free rate, RF, is currently 8% and that the market return, rm, is currently 15%. a. Calculate the market risk premium. b. Given the previous data, calculate the required return on asset A having a beta of 0.8 and asset B having a beta of 1.9. a. The market risk premium is ☐ %. (Round to one decimal place.) b. If the beta of asset A is 0.8, the required return for asset A is %. (Round to one decimal place.) If the beta of asset B is 1.9, the required return for asset B is %. (Round to one decimal place.)arrow_forward
- Risk and probability Micro-Pub, Inc., is considering the purchase of one of two digital cameras, R and S, each of which requires an initial investment of $4,000. Management has constructed the following table of estimates of rates of return and probabilities for pessimistic, most likely, and optimistic results: a. Determine the range for the rate of return for each of the two cameras. b. Determine the value of the expected return for each camera. c. Which camera purchase is riskier? Why? a. The range for the rate of return for camera R is %. (Round to the nearest whole number.) The range for the rate of return for camera S is ☐ %. (Round to the nearest whole number.) b. The value of the expected return for camera R is %. (Round to two decimal places.) The value of the expected return for camera S is %. (Round to two decimal places.) c. Which camera purchase is riskier? Why? (Select from the drop-down menus.) The purchase of is riskier because it has a range for the rate of return.arrow_forward4 analysts covered the stock of Flooring Chemical. One forecasts a 5% return for the coming year. The second expects the return to be -4%. The third predicts a return of 9%. The fourth expects a 1% return in the coming year. You are relatively confident that the return will be positive but not large, so you arbitrarily assign probabilities of being correct of 33%, 7%, 18%, and 42%, respectively to the analysts' forecasts. Given these probabilities, what is Flooring Chemical's expected return for the coming year?arrow_forwardWhy you would be a quality recipient of the Linda K Crandall Nutrition Scholarship.arrow_forward
- If Image is blurr then tell me . please comment below i will write values. if you answer with incorrect values i will give unhelpful confirm.arrow_forwardNormal probability distribution Assuming that the rates of return associated with a given asset investment are normally distributed; that the expected return, r, is 17.2%; and that the coefficient of variation, CV, is 0.86, answer the following questions: a. Find the standard deviation of returns, or. b. Calculate the range of expected return outcomes associated with the following probabilities of occurrence: (1) 68%, (2) 95%, (3) 99%. a. The standard deviation of returns, or, is %. (Round to three decimal places.) b. (1) The lowest possible expected return associated with the 68% probability of occurrence is %. (Round to two decimal places.) The highest possible expected return associated with the 68% probability of occurrence is decimal places.) (2) The lowest possible expected return associated with the 95% probability of occurrence is decimal places.) %. (Round to two %. (Round to two The highest possible expected return associated with the 95% probability of occurrence is decimal…arrow_forwardGeneral Finance Please don't answer i posted blurred image mistakely. please comment below i will write values. if you answer with incorrect values i will give unhelpful confirm.arrow_forward
 EBK CONTEMPORARY FINANCIAL MANAGEMENTFinanceISBN:9781337514835Author:MOYERPublisher:CENGAGE LEARNING - CONSIGNMENT
 Intermediate Financial Management (MindTap Course...FinanceISBN:9781337395083Author:Eugene F. Brigham, Phillip R. DavesPublisher:Cengage Learning

