
Concept explainers
Sketch the budget constraint.
Explanation of Solution
Maximum unit of good Y (0 unit of good X is purchased) that a person can purchase with the given income and
Substitute the respective values in Equation (1) to calculate the maximum unit of Y that can be purchased.
The maximum unit of Y is 200 units.
Maximum unit of good X (0 unit of good Y is purchased) that a person can purchase with the given income and price can be calculated by using the following formula:
Substitute the respective values in Equation (2) to calculate the maximum unit of X that can be purchased.
The maximum unit of X is 50 units.
Option (a):
Figure 1 shows the budget constraint of case “a”.
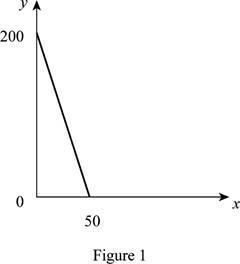
In Figure 1, the vertical axis measures the price of good Y and horizontal axis measures the price of good X. The downward sloping cure is the budget constrain of the household.
Option (b):
The maximum quantity of good X and Y is 25 and 40 respectively that is obtained by using Equation (1) and (2).
Figure 2 shows the budget constraint of case “b”.
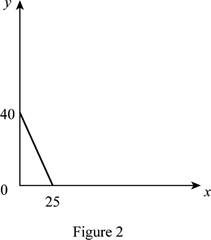
In Figure 2, the vertical axis measure price of good Y and horizontal axis measures price of good X. The downward sloping cure is the budget constrain of the household.
Option (c):
The maximum quantity of good X and Y is 40 and 5, respectively that is obtained by using Equation (1) and (2).
Figure 3 shows the budget constraint of case “c”.
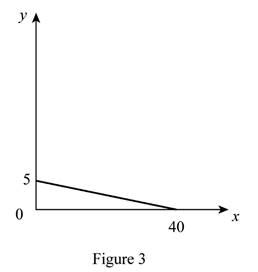
In Figure 3, the vertical axis measures the price of good Y and horizontal axis measures the price of good X. The downward sloping cure is the budget constrain of the household.
Option (d):
The maximum quantity of good X and Y is 20 and 50, respectively that is obtained by using Equation (1) and (2).
Figure 4 shows the budget constraint of case “d”.
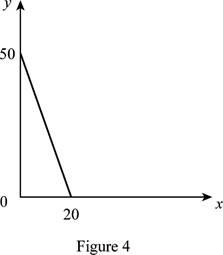
In Figure 4, the vertical axis measures the price of good Y and horizontal axis measures the price of good X. The downward sloping cure is the budget constrain of the household.
Option (e):
The maximum quantity of good X and Y is 4 and 6, respectively that is obtained by using Equation (1) and (2).
Figure 5 shows the budget constraint of case “e”.
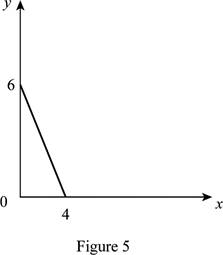
In Figure 5, the vertical axis measures the price of good Y and horizontal axis measures the price of good X. The downward sloping cure is the budget constrain of the household.
Option (f):
The maximum quantity of good X and Y is 24 and 4, respectively that is obtained by using Equation (1) and (2).
Figure 6 shows the budget constraint of case “f”.
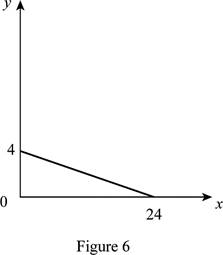
In Figure 6, the vertical axis measures the price of good Y and horizontal axis measures the price of good X. The downward sloping cure is the budget constrain of the household.
Option (g)
The maximum quantity of good X and Y is 4 and 24, respectively that is obtained by using Equation (1) and (2).
Figure 7 shows the budget constraint of case “g”.
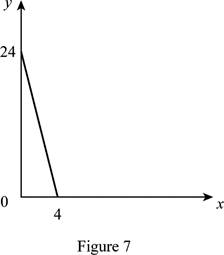
In Figure 7, the vertical axis measures the price of good Y and horizontal axis measures the price of good X. The downward sloping cure is the budget constrain of the household.
Budget constraints: Restrictions imposed on household’s choices by the factors like wealth, income and price of product are termed as the budget constraint.
Want to see more full solutions like this?
Chapter 6 Solutions
Principles of Microeconomics (12th Edition)
- How Command Economics Relate to Principle Of Economics?arrow_forwardhow commond economies relate to principle Of Economics ?arrow_forwardCritically analyse the five (5) characteristics of Ubuntu and provide examples of how they apply to the National Health Insurance (NHI) in South Africa.arrow_forward
- Critically analyse the five (5) characteristics of Ubuntu and provide examples of how they apply to the National Health Insurance (NHI) in South Africa.arrow_forwardOutline the nine (9) consumer rights as specified in the Consumer Rights Act in South Africa.arrow_forwardIn what ways could you show the attractiveness of Philippines in the form of videos/campaigns to foreign investors? Cite 10 examples.arrow_forward
- Explain the following terms and provide an example for each term: • Corruption • Fraud • Briberyarrow_forwardIn what ways could you show the attractiveness of a country in the form of videos/campaigns?arrow_forwardWith the VBS scenario in mind, debate with your own words the view that stakeholders are the primary reason why business ethics must be implemented.arrow_forward
- The unethical decisions taken by the VBS management affected the lives of many of their clients who trusted their business and services You are appointed as an ethics officer at Tyme Bank. Advise the management regarding the role of legislation in South Africa in providing the legal framework for business operations.arrow_forwardTyme Bank is a developing bank in South Africa and could potentially encounter challenges similar to those faced by VBS in the future. Explain five (5) benefits of applying business ethics at Tyme Bank to prevent similar ethical scandals.arrow_forward1.3. Explain the five (5) ethical challenges that can be associated with the implementation of the National Health Insurance (NHI) in South Africa.arrow_forward

 Economics Today and Tomorrow, Student EditionEconomicsISBN:9780078747663Author:McGraw-HillPublisher:Glencoe/McGraw-Hill School Pub Co
 Economics (MindTap Course List)EconomicsISBN:9781337617383Author:Roger A. ArnoldPublisher:Cengage Learning
 Principles of Economics 2eEconomicsISBN:9781947172364Author:Steven A. Greenlaw; David ShapiroPublisher:OpenStax


