
a)
To draw: A decision tree diagram.
Introduction:
Decision tree is one of the methods used in decision-making process. It would graphically represent the available alternatives and states of nature. It would also mention the payoffs and probabilities of the alternatives. It helps to choose the best alternative that would give the best result among the alternatives.
a)
Answer to Problem 4P
Explanation of Solution
Given information:
If small facility is build:
When demand is lower, then
When demand is higher, then two alternatives are as follows:
First alternative: To maintain and NPV is $50,000
Second alternative: To expand and NPV is $450,000
If large facility is build:
Demand is high: NPV is $800,000
Demand is low: NPV is -$10,000
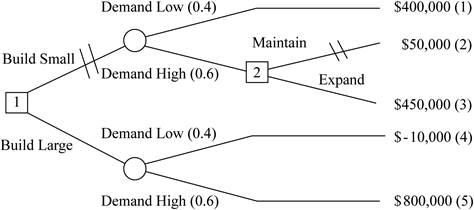
Decision tree diagram:
Explanation:
Here we see that there are (1) two alternative decision small facility to build or to large facility to build. First alternative is to build small facility and there is also two sub parts, first is low demand and second is high demand. In high demand there are (2) two alternative decisions which has also two parts; first has to be maintained and other is expand.
Decision is based on right to left in decisions. We can see that expand have higher NPV that other alternatives.
Calculate the decision alternative payoffs:
It is given that probability of low demand is 40%, and high demand is 60%.
Small facility to build:
If low demand:
Therefore, the payoff of low demand is $160,000.
If high demand:
Therefore, the payoff of high demand is $270,000.
Large facility to build:
If low demand:
If high demand:
Calculate the expected value of each alternative:
Small facility to build:
Large facility to build
Here, we see that highest expected value is for larger facility to build so this alternative need to select and small facility alternative have double slash.
b)
To determine: To calculate expected value of perfect information.
Expected value of perfect information: It is the rate that a person is willing to pay to gain access to get perfect information. A common area which uses expected value of perfect information is the healthcare economy. This value tries to evaluate the expected cost of the uncertainty, which can be interpreted as the expected value of perfect information.
b)
Answer to Problem 4P
Explanation of Solution
Explanation
Calculation of expected value of perfect information:
Step 1: Calculate the expected value with perfection information or Expected payoff under certainty:
Therefore, expected value with perfection information is $640,000.
Step 2: Calculation of the expected value of perfect information:
Hence, the expected value of perfect information is $164,000.
c)
To determine: The range over each alternative that are best in term of the value of P.
Introduction: Decision table to evaluate the range over each alternative. Decision table is formats or visual representations were data is expressed arranged, determined and calculated to make an effective decision making. A decision table is a tabular representation that is used to analyze decision alternatives and states of nature.
c)
Explanation of Solution
Decision table is based on each alternative which are relative to P (low) and graph of low demand and high demand:
| Alternative | High Demand | Low Demand |
| Build Small | $450,000 | 400,000 |
| Build Large | $800,000 | -$10,000.00 |
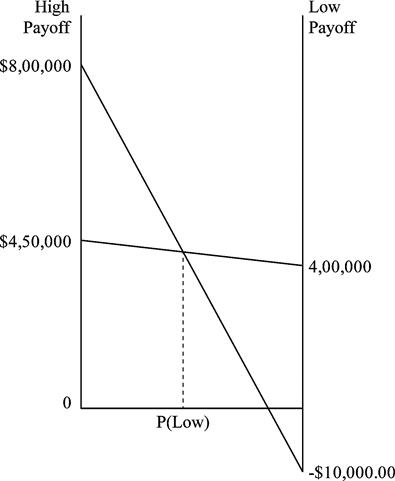
From the above graph we can obtain that optimal value of P (low) over each alternative are, for low value of P (low) here we decide to build large facilities because we are getting higher expected value. For high value of P (low) we decided to build small facility because we are getting higher expected value.
Calculate the exact value of range:
Equations:
Build Small: 450,000 – 50,000P (slope = 400,000 – 450,000)
Build Large:800,000 – 810,000P (slope = -10,000 – 800,000)
Find the intersection between the two lines:
Optimal ranges:
Build Large: P (Low) = 0 to < .4605
Build Small: P (Low) > .4605 to 1.00
Want to see more full solutions like this?
Chapter 5 Solutions
EBK OPERATIONS MANAGEMENT

- Ruby-Star Incorporated is considering two different vendors for one of its top-selling products which has an average weekly demand of 70 units and is valued at $90 per unit. Inbound shipments from vendor 1 will average 390 units with an average lead time (including ordering delays and transit time) of 4 weeks. Inbound shipments from vendor 2 will average 490 units with an average lead time of 2 weeksweeks. Ruby-Star operates 52 weeks per year; it carries a 4-week supply of inventory as safety stock and no anticipation inventory. Part 2 a. The average aggregate inventory value of the product if Ruby-Star used vendor 1 exclusively is $enter your response here.arrow_forwardSam's Pet Hotel operates 50 weeks per year, 6 days per week, and uses a continuous review inventory system. It purchases kitty litter for $13.00 per bag. The following information is available about these bags: > Demand 75 bags/week > Order cost = $52.00/order > Annual holding cost = 20 percent of cost > Desired cycle-service level = 80 percent >Lead time = 5 weeks (30 working days) > Standard deviation of weekly demand = 15 bags > Current on-hand inventory is 320 bags, with no open orders or backorders. a. Suppose that the weekly demand forecast of 75 bags is incorrect and actual demand averages only 50 bags per week. How much higher will total costs be, owing to the distorted EOQ caused by this forecast error? The costs will be $higher owing to the error in EOQ. (Enter your response rounded to two decimal places.)arrow_forwardYellow Press, Inc., buys paper in 1,500-pound rolls for printing. Annual demand is 2,250 rolls. The cost per roll is $625, and the annual holding cost is 20 percent of the cost. Each order costs $75. a. How many rolls should Yellow Press order at a time? Yellow Press should order rolls at a time. (Enter your response rounded to the nearest whole number.)arrow_forward
- Please help with only the one I circled! I solved the others :)arrow_forwardOsprey Sports stocks everything that a musky fisherman could want in the Great North Woods. A particular musky lure has been very popular with local fishermen as well as those who buy lures on the Internet from Osprey Sports. The cost to place orders with the supplier is $40/order; the demand averages 3 lures per day, with a standard deviation of 1 lure; and the inventory holding cost is $1.00/lure/year. The lead time form the supplier is 10 days, with a standard deviation of 2 days. It is important to maintain a 97 percent cycle-service level to properly balance service with inventory holding costs. Osprey Sports is open 350 days a year to allow the owners the opportunity to fish for muskies during the prime season. The owners want to use a continuous review inventory system for this item. Refer to the standard normal table for z-values. a. What order quantity should be used? lures. (Enter your response rounded to the nearest whole number.)arrow_forwardIn a P system, the lead time for a box of weed-killer is two weeks and the review period is one week. Demand during the protection interval averages 262 boxes, with a standard deviation of demand during the protection interval of 40 boxes. a. What is the cycle-service level when the target inventory is set at 350 boxes? Refer to the standard normal table as needed. The cycle-service level is ☐ %. (Enter your response rounded to two decimal places.)arrow_forward
- Oakwood Hospital is considering using ABC analysis to classify laboratory SKUs into three categories: those that will be delivered daily from their supplier (Class A items), those that will be controlled using a continuous review system (B items), and those that will be held in a two bin system (C items). The following table shows the annual dollar usage for a sample of eight SKUs. Fill in the blanks for annual dollar usage below. (Enter your responses rounded to the mearest whole number.) Annual SKU Unit Value Demand (units) Dollar Usage 1 $1.50 200 2 $0.02 120,000 $ 3 $1.00 40,000 $ 4 $0.02 1,200 5 $4.50 700 6 $0.20 60,000 7 $0.90 350 8 $0.45 80arrow_forwardA part is produced in lots of 1,000 units. It is assembled from 2 components worth $30 total. The value added in production (for labor and variable overhead) is $30 per unit, bringing total costs per completed unit to $60 The average lead time for the part is 7 weeks and annual demand is 3800 units, based on 50 business weeks per year. Part 2 a. How many units of the part are held, on average, in cycle inventory? enter your response here unitsarrow_forwardassume the initial inventory has no holding cost in the first period and back orders are not permitted. Allocating production capacity to meet demand at a minimum cost using the transportation method. What is the total cost? ENTER your response is a whole number (answer is not $17,000. That was INCORRECT)arrow_forward
- Regular Period Time Overtime Supply Available puewag Subcontract Forecast 40 15 15 40 2 35 40 28 15 15 20 15 22 65 60 Initial inventory Regular-time cost per unit Overtime cost per unit Subcontract cost per unit 20 units $100 $150 $200 Carrying cost per unit per month 84arrow_forwardassume that the initial inventory has no holding cost in the first period, and back orders are not permitted. Allocating production capacity to meet demand at a minimum cost using the transportation method. The total cost is? (enter as whole number)arrow_forwardThe S&OP team at Kansas Furniture, led by David Angelow, has received estimates of demand requirements as shown in the table. Assuming one-time stockout costs for lost sales of $125 per unit, inventory carrying costs of $30 per unit per month, and zero beginning and ending inventory, evaluate the following plan on an incremental cost basis: Plan B: Vary the workforce to produce the prior month's demand. Demand was 1,300 units in June. The cost of hiring additional workers is $35 per unit produced. The cost of layoffs is $60 per unit cut back. (Enter all responses as whole numbers.) Note: Both hiring and layoff costs are incurred in the month of the change (i.e., going from production of 1,300 in July to 1300 in August requires a layoff (and related costs) of 0 units in August). Hire Month 1 July Demand 1300 Production (Units) Layoff (Units) Ending Inventory Stockouts (Units) 2 August 1150 3 September 1100 4 October 1600 5 November 1900 6 December 1900arrow_forward
 Practical Management ScienceOperations ManagementISBN:9781337406659Author:WINSTON, Wayne L.Publisher:Cengage,
 Purchasing and Supply Chain ManagementOperations ManagementISBN:9781285869681Author:Robert M. Monczka, Robert B. Handfield, Larry C. Giunipero, James L. PattersonPublisher:Cengage Learning
 MarketingMarketingISBN:9780357033791Author:Pride, William MPublisher:South Western Educational Publishing