
Using & Understanding Mathematics: A Quantitative Reasoning Approach (7th Edition)
7th Edition
ISBN: 9780134705187
Author: Jeffrey O. Bennett, William L. Briggs
Publisher: PEARSON
expand_more
expand_more
format_list_bulleted
Concept explainers
Videos
Textbook Question
Chapter 5.E, Problem 15E
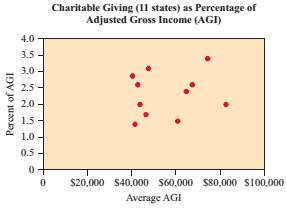
Interpreting Scatterplots. Consider the following scatterplots.
a. State whether the diagram shows a
b. Summarize any conclusions that you can draw from the díagram.
15. 
Expert Solution & Answer
Want to see the full answer?
Check out a sample textbook solution
Students have asked these similar questions
A straight-line H is tangent to the function g(x)=-6x-3+ 8 and passes through the point (-
4,7). Determine,
the gradient of the straight-line Choose....
y-intercept of the straight-line Choose... +
which of the following is the answers -1.125 -6.72 1.125 7.28 0.07 -
7.28 6.72
Can you help me find the result of an integral
+
a
炉[メをメ
+炉な
2
a
Can you help me find the result of an integral
a
아
x² dx
Chapter 5 Solutions
Using & Understanding Mathematics: A Quantitative Reasoning Approach (7th Edition)
Ch. 5.A - You conduct a poll in which you randomly select...Ch. 5.A - Results of the poll described in question 1 would...Ch. 5.A - When we say that a sample is representative of the...Ch. 5.A - A poll concerning support for mass transit is...Ch. 5.A - Consider an experiment designed to test whether...Ch. 5.A - The experiment described in question 4 is a....Ch. 5.A - The purpose of a placebo is a. to prevent...Ch. 5.A - An experiment is single-blind if a. it lacks a...Ch. 5.A - Poll X predicts that Powell will receive 49% of...Ch. 5.A - A survey reveals that 12% of Americans believe...
Ch. 5.A - 1. Why do we say that the term statistics has two...Ch. 5.A - 2. Define the terms populatíon, sample, population...Ch. 5.A - Describe the five basic steps in a statistical...Ch. 5.A - Why is a so important that a statistical study use...Ch. 5.A - Prob. 5ECh. 5.A - Prob. 6ECh. 5.A - What is a placebo? Describe the placebo effect and...Ch. 5.A - What is meant by the margin of error in a survey...Ch. 5.A - In my experimental study, I used a sample that was...Ch. 5.A - I followed all the guidelines for sample selection...Ch. 5.A - I wanted to test the effects of vitamin C on...Ch. 5.A - I don’t believe the results of the experiment...Ch. 5.A - A pollster plans to improve survey results by...Ch. 5.A - By choosing my sample carefully, I can make a good...Ch. 5.A - Population and Sample. For the following studies,...Ch. 5.A - 15–20: Population and Sample. For the following...Ch. 5.A - 15–20: Population and Sample. For the following...Ch. 5.A - In a test of the effectiveness of garlic for...Ch. 5.A - In an Accountemps survey of 150 senior executives,...Ch. 5.A - Population and Sample. For the following studies,...Ch. 5.A - Prob. 21ECh. 5.A - Prob. 22ECh. 5.A - Prob. 23ECh. 5.A - Steps in a Study. Describe how you would apply the...Ch. 5.A - 21-26: Steps in a Study. Describe how you would...Ch. 5.A - Prob. 26ECh. 5.A - Representative Sample? You want to determine the...Ch. 5.A - Representative Sample? You want to determine the...Ch. 5.A - Identify the Sampling Method. Identify the...Ch. 5.A - Identify the Sampling Method. Identify the...Ch. 5.A - Identify the Sampling Method. Identify the...Ch. 5.A - Identify the Sampling Method. Identify the...Ch. 5.A - Identify the Sampling Method. Identify the...Ch. 5.A - Identify the Sampling Method. Identify the...Ch. 5.A - Type of Study. Determine whether the following...Ch. 5.A - Type of Study. Determine whether the following...Ch. 5.A - Type of Study. Determine whether each of the...Ch. 5.A - Type of Study. Determine whether the following...Ch. 5.A - Prob. 39ECh. 5.A - Prob. 40ECh. 5.A - Prob. 41ECh. 5.A - Prob. 42ECh. 5.A - Prob. 43ECh. 5.A - Prob. 44ECh. 5.A - Prob. 45ECh. 5.A - Prob. 46ECh. 5.A - Margin of Error. The following summaries of...Ch. 5.A - A Gallup poll found that 36% of Americans favor a...Ch. 5.A - Margin of Error. The following summaries of...Ch. 5.A - Margin of Error. The following summaries of...Ch. 5.A - Effectiveness of a New Drug. As part of the U.S....Ch. 5.A - Real Studies. Consider the following statistical...Ch. 5.A - Real Studies. Consider the following statistical...Ch. 5.A - Prob. 54ECh. 5.A - 55. A Fox News poll carried out by phone...Ch. 5.A - Prob. 56ECh. 5.A - Prob. 57ECh. 5.A - Prob. 58ECh. 5.A - Statistics in the News. Select three news stories...Ch. 5.A - 62. Statistics in Your Major. Write two to three...Ch. 5.A - Prob. 61ECh. 5.A - Prob. 62ECh. 5.A - 65. Poor Sampling. Find a new article about a...Ch. 5.A - 66. Good Sampling. Find a recent news article that...Ch. 5.A - 67. Margin of Error. Find a report of a recent...Ch. 5.A - Prob. 66ECh. 5.A - Prob. 67ECh. 5.B - You read about an issue that was the subject of an...Ch. 5.B - A study conducted by the oil company Exxon Mobil...Ch. 5.B - Consider a study designed to learn about the...Ch. 5.B - The show The Voice selects winners based on votes...Ch. 5.B - Consider an experiment in which you measure the...Ch. 5.B - Consider a survey in which 1000 people arc asked...Ch. 5.B - Imagine that a survey of randomly selected people...Ch. 5.B - You want to know whether people prefer Smith or...Ch. 5.B - A self-selected survey is one in which a. the...Ch. 5.B - If a statistical study is carefully conducted tn...Ch. 5.B - Prob. 1ECh. 5.B - Prob. 2ECh. 5.B - Prob. 3ECh. 5.B - Prob. 4ECh. 5.B - More than 1 million people sent texts in response...Ch. 5.B - Thc survey of religious beliefs suffered from...Ch. 5.B - My experiment proved beyond a doubt that vitamin C...Ch. 5.B - Everyone who jogs for exercise should try the new...Ch. 5.B - Prob. 9ECh. 5.B - Should You Believe This Study? Based solely on the...Ch. 5.B - 9-20: Should You Believe This Study? Based solely...Ch. 5.B - 9–20: Should You Believe This Study? Based solely...Ch. 5.B - Should You Believe This Study? Based solely on the...Ch. 5.B - Prob. 14ECh. 5.B - Should You Believe This Study? Based solely on the...Ch. 5.B - Should You Believe This Study? Based solely on the...Ch. 5.B - Prob. 17ECh. 5.B - Should You Believe This Study? Based solely on the...Ch. 5.B - Should You Believe This Study? Based solely on the...Ch. 5.B - Prob. 20ECh. 5.B - 21–26: Should You Believe This Claim? Based solely...Ch. 5.B - Prob. 22ECh. 5.B - Prob. 23ECh. 5.B - Prob. 24ECh. 5.B - Prob. 25ECh. 5.B - Should You Believe This Claim? Based solely on the...Ch. 5.B - Prob. 27ECh. 5.B - Prob. 28ECh. 5.B - Bias. Identify at least one potential source of...Ch. 5.B - Prob. 30ECh. 5.B - Bias. Identify at least one potential source of...Ch. 5.B - Prob. 32ECh. 5.B - Prob. 33ECh. 5.B - Prob. 34ECh. 5.B - 35. Its All in the Wording. Princeton Survey...Ch. 5.B - 36. It’s All in the Wording. The Pew Research...Ch. 5.B - Prob. 37ECh. 5.B - Stat-Bytes. Much like sound bytes of news stories,...Ch. 5.B - Prob. 39ECh. 5.B - Prob. 40ECh. 5.B - Prob. 41ECh. 5.B - Prob. 42ECh. 5.B - Accurate Headlines? Consider the following...Ch. 5.B - 43–44: Accurate Headlines? Consider the following...Ch. 5.B - 45. What is the Question? Discuss the differences...Ch. 5.B - 46. Exercise and Dementia. A recent study in the...Ch. 5.B - Prob. 47ECh. 5.B - Prob. 48ECh. 5.B - Prob. 49ECh. 5.B - Prob. 50ECh. 5.B - Prob. 51ECh. 5.C - In a class of 200 students, 50 students received a...Ch. 5.C - For the class described in question 1, what was...Ch. 5.C - Which of the following is an example of...Ch. 5.C - The sizes of the wedges in a pie chart tell you a....Ch. 5.C - You have a table listing ten tourist attractions...Ch. 5.C - In the table of tourist attractions and visitors...Ch. 5.C - You have a list of the GPAs of 100 college...Ch. 5.C - You have a list of the average gasoline price for...Ch. 5.C - A histogram is a. a graph that shows how some...Ch. 5.C - You have a histogram and you want to convert it...Ch. 5.C - Prob. 1ECh. 5.C - Prob. 2ECh. 5.C - Prob. 3ECh. 5.C - Prob. 4ECh. 5.C - Prob. 5ECh. 5.C - 6. What two types of graphs are most common when...Ch. 5.C - I made a frequency table with two columns, one...Ch. 5.C - The relative frequency of B grades in our class...Ch. 5.C - The cumulative frequency of C grades in our class...Ch. 5.C - Your bar graph must be wrong, because you have 10...Ch. 5.C - Your pie chart must be wrong, because when I added...Ch. 5.C - I rearranged the bars on my histogram the tallest...Ch. 5.C - 13-14: Frequency Tables. Make frequency tables for...Ch. 5.C - Prob. 14ECh. 5.C - 15-22: Qualitative versus Quantitative. Determine...Ch. 5.C - Qualitative versus Quantitative. Determine whether...Ch. 5.C - 15-22: Qualitative versus Quantitative. Determine...Ch. 5.C - Qualitative versus Quantitative. Determine whether...Ch. 5.C - Qualitative versus Quantitative. Determine whether...Ch. 5.C - Qualitative versus Quantitative. Determine whether...Ch. 5.C - 15-22: Qualitative versus Quantitative. Determine...Ch. 5.C - Qualitative versus Quantitative. Determine whether...Ch. 5.C - Binned Frequency Tables. Use the given bin sizes...Ch. 5.C - Binned Frequency Tables. Use the given bin sizes...Ch. 5.C - 25. Most Populous Countries. The following table...Ch. 5.C - Prob. 26ECh. 5.C - Prob. 27ECh. 5.C - Prob. 28ECh. 5.C - Prob. 29ECh. 5.C - Prob. 30ECh. 5.C - 31. Cell Phone Subscriptions. The following table...Ch. 5.C - 32. Death Rates. Figure 5.10 is a time-series...Ch. 5.C - U.S. Electrical Energy. The following table gives...Ch. 5.C - Prob. 34ECh. 5.C - Ages of Nobel Prize Winners. The Following...Ch. 5.C - Prob. 36ECh. 5.C - Prob. 37ECh. 5.C - Prob. 38ECh. 5.C - Immigrant Data. The following table gives the...Ch. 5.C - Prob. 40ECh. 5.C - Prob. 41ECh. 5.C - 49. Bar Graph. Find a recent news article tha...Ch. 5.C - 50. Pie Chart. Find a recent news article that...Ch. 5.C - 51. Histogram. Find a recent news article that...Ch. 5.C - 52. Line Chart. Find a recent news article that...Ch. 5.C - Answer the following questions using procedures...Ch. 5.C - 47. U.S. Population in Poverty. Use Excel or with...Ch. 5.C - 48. StatCrunch Data Entry. To gain practice...Ch. 5.C - 49. NFL Data. Open the shared data set called NFL...Ch. 5.C - Prob. 50ECh. 5.D - Based on Figure 5.12, which statement is correct?...Ch. 5.D - Prob. 2QQCh. 5.D - Prob. 3QQCh. 5.D - Prob. 4QQCh. 5.D - Prob. 5QQCh. 5.D - Prob. 6QQCh. 5.D - Which of the following best describes the...Ch. 5.D - Prob. 8QQCh. 5.D - 9. Consider Figure 5.22(a). Moving one tick mark...Ch. 5.D - 10. Consider Figure 5.23(a). In years where the...Ch. 5.D - Briefly describe the construction and use of...Ch. 5.D - What are geographical data? Briefly describe at...Ch. 5.D - What are three-dimensional graphics? Explain the...Ch. 5.D - What are infographics, and what is their goal?Ch. 5.D - Prob. 5ECh. 5.D - 6. What is an exponential scale? When is an...Ch. 5.D - Explain how a graph that shows percentage change...Ch. 5.D - Prob. 8ECh. 5.D - My bar chart contains more information than yours,...Ch. 5.D - 10. I used an exponential scale because the data...Ch. 5.D - Prob. 11ECh. 5.D - A graph showing the yearly rate of increase in the...Ch. 5.D - Educational Value. Use the graphs in Figure 5.11...Ch. 5.D - 13-16: Educational Value. Use the graphs in Figure...Ch. 5.D - Prob. 15ECh. 5.D - Prob. 16ECh. 5.D - Gender and Mathematics. Consider the data...Ch. 5.D - Gender and Science. The following table gives data...Ch. 5.D - Prob. 19ECh. 5.D - Prob. 20ECh. 5.D - Disease Stack Plot. Use Figure 5.14 to answer the...Ch. 5.D - Disease Stack Plot. Use Figure 5.14 to answer the...Ch. 5.D - 23. Figure 5.24 shows a stack plot of federal...Ch. 5.D - 24. College Degrees. Figure 5.25 shows the numbers...Ch. 5.D - 25-26: Melanoma Mortality. Figure 5.26 shows the...Ch. 5.D - Prob. 26ECh. 5.D - Prob. 27ECh. 5.D - Prob. 28ECh. 5.D - Prob. 29ECh. 5.D - Prob. 30ECh. 5.D - Prob. 31ECh. 5.D - Infographic. Use Figure 5.18 to answer the...Ch. 5.D - Volume Distortion. Figure 5.29 depicts the amounts...Ch. 5.D - Three-DimensionaI Pies. The pie charts in Figure...Ch. 5.D - Refugees to Europe. Figure 5.31 shows the numbers...Ch. 5.D - 36. Life Expectancy. Figure 5.32 shows the life...Ch. 5.D - 37. Moore’s Law. Moore law refers to a prediction...Ch. 5.D - Prob. 38ECh. 5.D - Prob. 39ECh. 5.D - Percentage Change in the CPI. Figure 5.33 shows...Ch. 5.D - Prob. 41ECh. 5.D - Prob. 42ECh. 5.D - Prob. 43ECh. 5.D - Prob. 44ECh. 5.D - Prob. 45ECh. 5.D - Prob. 46ECh. 5.D - 47-52: Creating Graphics. Make a graphical display...Ch. 5.D - 47-52: Creating Graphics. Make a graphical display...Ch. 5.D - Creating Graphics. Make a graphical display of the...Ch. 5.D - Prob. 50ECh. 5.D - Prob. 51ECh. 5.D - Prob. 52ECh. 5.D - Prob. 53ECh. 5.D - Prob. 54ECh. 5.D - Prob. 55ECh. 5.D - Prob. 56ECh. 5.D - Prob. 57ECh. 5.D - Prob. 58ECh. 5.D - Prob. 59ECh. 5.D - 46. Interactive Infographics. Find a few examples...Ch. 5.D - Answer the following questions using procedures...Ch. 5.D - Answer the following questions using procedures...Ch. 5.D - Prob. 63ECh. 5.D - Prob. 64ECh. 5.D - Prob. 65ECh. 5.D - Answer the following questions using procedures...Ch. 5.D - Prob. 67ECh. 5.D - Prob. 68ECh. 5.E - If X is correlated with Y, a. X causes Y. b....Ch. 5.E - Figure 5.40. According to this diagram, life...Ch. 5.E - If the points on a scatterplot fall on a nearly...Ch. 5.E - If the points on a scatterplot fall into a broad...Ch. 5.E - When can you rule out the possibility that changes...Ch. 5.E - What type of correlation would you expect between...Ch. 5.E - You have found a higher rate of birth defects...Ch. 5.E - Based on the data in Figure 5.38, abou how much...Ch. 5.E - Which of the following statements best describes...Ch. 5.E - A finding by a jury that a pcrson is guilty...Ch. 5.E - What is a correlation? Give three examples of...Ch. 5.E - What is a scatterplot, and how is one made? How...Ch. 5.E - Prob. 3ECh. 5.E - Describe the three general categories of...Ch. 5.E - 5. Briefly describe each of the six guidelines...Ch. 5.E - Briefly describe three levels of confidence in...Ch. 5.E - There is a strong negative correlation between the...Ch. 5.E - There is a strong positive correlation between the...Ch. 5.E - I found a nearly perfect positive correlation...Ch. 5.E - I found a nearly perfect negative correlation...Ch. 5.E - I had originally suspected that an increase in...Ch. 5.E - Prob. 12ECh. 5.E - Interpreting Scatterplots. Consider the following...Ch. 5.E - Interpreting Scatterplots. Consider the following...Ch. 5.E - Interpreting Scatterplots. Consider the following...Ch. 5.E - Interpreting Scatterplots. Consider the following...Ch. 5.E - Types of Correlation. For the following pairs of...Ch. 5.E - Types of Correlation. For the following pairs of...Ch. 5.E - Types of Correlation. For the following pairs of...Ch. 5.E - Prob. 20ECh. 5.E - Prob. 21ECh. 5.E - Prob. 22ECh. 5.E - 17–24: Types of Correlation. For the following...Ch. 5.E - Prob. 24ECh. 5.E - Prob. 25ECh. 5.E - Making Scatterplots. Consider the following data...Ch. 5.E - Making Scatterplots. Consider the following data...Ch. 5.E - Prob. 28ECh. 5.E - Prob. 29ECh. 5.E - Making Scatterplots. Consider the following data...Ch. 5.E - Federal Aid and Graduation Rates. Figure 5.43...Ch. 5.E - Correlation and Causality. Consider the following...Ch. 5.E - Correlation and Causality. Consider the following...Ch. 5.E - Correlation and Causality. Consider the following...Ch. 5.E - Correlation and Causality. Consider the following...Ch. 5.E - Correlation and Causality. Consider the following...Ch. 5.E - Correlation and Causality. Consider the following...Ch. 5.E - 38. Identifying Causes: Headaches. You are trying...Ch. 5.E - 39. Smoking and Lung Cancer. There is a strong...Ch. 5.E - Prob. 40ECh. 5.E - Prob. 41ECh. 5.E - Prob. 42ECh. 5.E - Prob. 43ECh. 5.E - Prob. 44ECh. 5.E - Prob. 45ECh. 5.E - Prob. 46ECh. 5.E - Prob. 47ECh. 5.E - Answer the following questions using procedures...Ch. 5.E - Exercise and TV Open the shared data set called...Ch. 5.E - 50. StatCrunch Project. Choose one data set...
Knowledge Booster


Learn more about
Need a deep-dive on the concept behind this application? Look no further. Learn more about this topic, subject and related others by exploring similar questions and additional content below.Similar questions
- You are required to match the correct response to each statement provided. Another term/word that can be used synonymously to Choose... gradient. A term/phrase that is associated with Arithmetic Progression. Common difference → An identity matrix can be referred to as a Choose... ÷ What is the inequality sign that represents "at most"? VIarrow_forwarde). n! (n - 1)!arrow_forwardSuppose you flip a fair two-sided coin four times and record the result. a). List the sample space of this experiment. That is, list all possible outcomes that could occur when flipping a fair two-sided coin four total times. Assume the two sides of the coin are Heads (H) and Tails (T).arrow_forward
- I need help in ensuring that I explain it propleryy in the simplifest way as possiblearrow_forward(c) Because logistic regression predicts probabilities of outcomes, observations used to build a logistic regression model need not be independent. A. false: all observations must be independent B. true C. false: only observations with the same outcome need to be independent I ANSWERED: A. false: all observations must be independent. (This was marked wrong but I have no idea why. Isn't this a basic assumption of logistic regression)arrow_forwardBusiness discussarrow_forward
- Spam filters are built on principles similar to those used in logistic regression. We fit a probability that each message is spam or not spam. We have several variables for each email. Here are a few: to_multiple=1 if there are multiple recipients, winner=1 if the word 'winner' appears in the subject line, format=1 if the email is poorly formatted, re_subj=1 if "re" appears in the subject line. A logistic model was fit to a dataset with the following output: Estimate SE Z Pr(>|Z|) (Intercept) -0.8161 0.086 -9.4895 0 to_multiple -2.5651 0.3052 -8.4047 0 winner 1.5801 0.3156 5.0067 0 format -0.1528 0.1136 -1.3451 0.1786 re_subj -2.8401 0.363 -7.824 0 (a) Write down the model using the coefficients from the model fit.log_odds(spam) = -0.8161 + -2.5651 + to_multiple + 1.5801 winner + -0.1528 format + -2.8401 re_subj(b) Suppose we have an observation where to_multiple=0, winner=1, format=0, and re_subj=0. What is the predicted probability that this message is spam?…arrow_forwardConsider an event X comprised of three outcomes whose probabilities are 9/18, 1/18,and 6/18. Compute the probability of the complement of the event. Question content area bottom Part 1 A.1/2 B.2/18 C.16/18 D.16/3arrow_forwardI need help making sure that I explain this part accutartly.arrow_forward
arrow_back_ios
SEE MORE QUESTIONS
arrow_forward_ios
Recommended textbooks for you
 Glencoe Algebra 1, Student Edition, 9780079039897...AlgebraISBN:9780079039897Author:CarterPublisher:McGraw Hill
 Big Ideas Math A Bridge To Success Algebra 1: Stu...AlgebraISBN:9781680331141Author:HOUGHTON MIFFLIN HARCOURTPublisher:Houghton Mifflin Harcourt
 Holt Mcdougal Larson Pre-algebra: Student Edition...AlgebraISBN:9780547587776Author:HOLT MCDOUGALPublisher:HOLT MCDOUGAL
 Functions and Change: A Modeling Approach to Coll...AlgebraISBN:9781337111348Author:Bruce Crauder, Benny Evans, Alan NoellPublisher:Cengage Learning
Glencoe Algebra 1, Student Edition, 9780079039897...
Algebra
ISBN:9780079039897
Author:Carter
Publisher:McGraw Hill
Big Ideas Math A Bridge To Success Algebra 1: Stu...
Algebra
ISBN:9781680331141
Author:HOUGHTON MIFFLIN HARCOURT
Publisher:Houghton Mifflin Harcourt
Holt Mcdougal Larson Pre-algebra: Student Edition...
Algebra
ISBN:9780547587776
Author:HOLT MCDOUGAL
Publisher:HOLT MCDOUGAL
Functions and Change: A Modeling Approach to Coll...
Algebra
ISBN:9781337111348
Author:Bruce Crauder, Benny Evans, Alan Noell
Publisher:Cengage Learning
Correlation Vs Regression: Difference Between them with definition & Comparison Chart; Author: Key Differences;https://www.youtube.com/watch?v=Ou2QGSJVd0U;License: Standard YouTube License, CC-BY
Correlation and Regression: Concepts with Illustrative examples; Author: LEARN & APPLY : Lean and Six Sigma;https://www.youtube.com/watch?v=xTpHD5WLuoA;License: Standard YouTube License, CC-BY