
Concept explainers
Videos
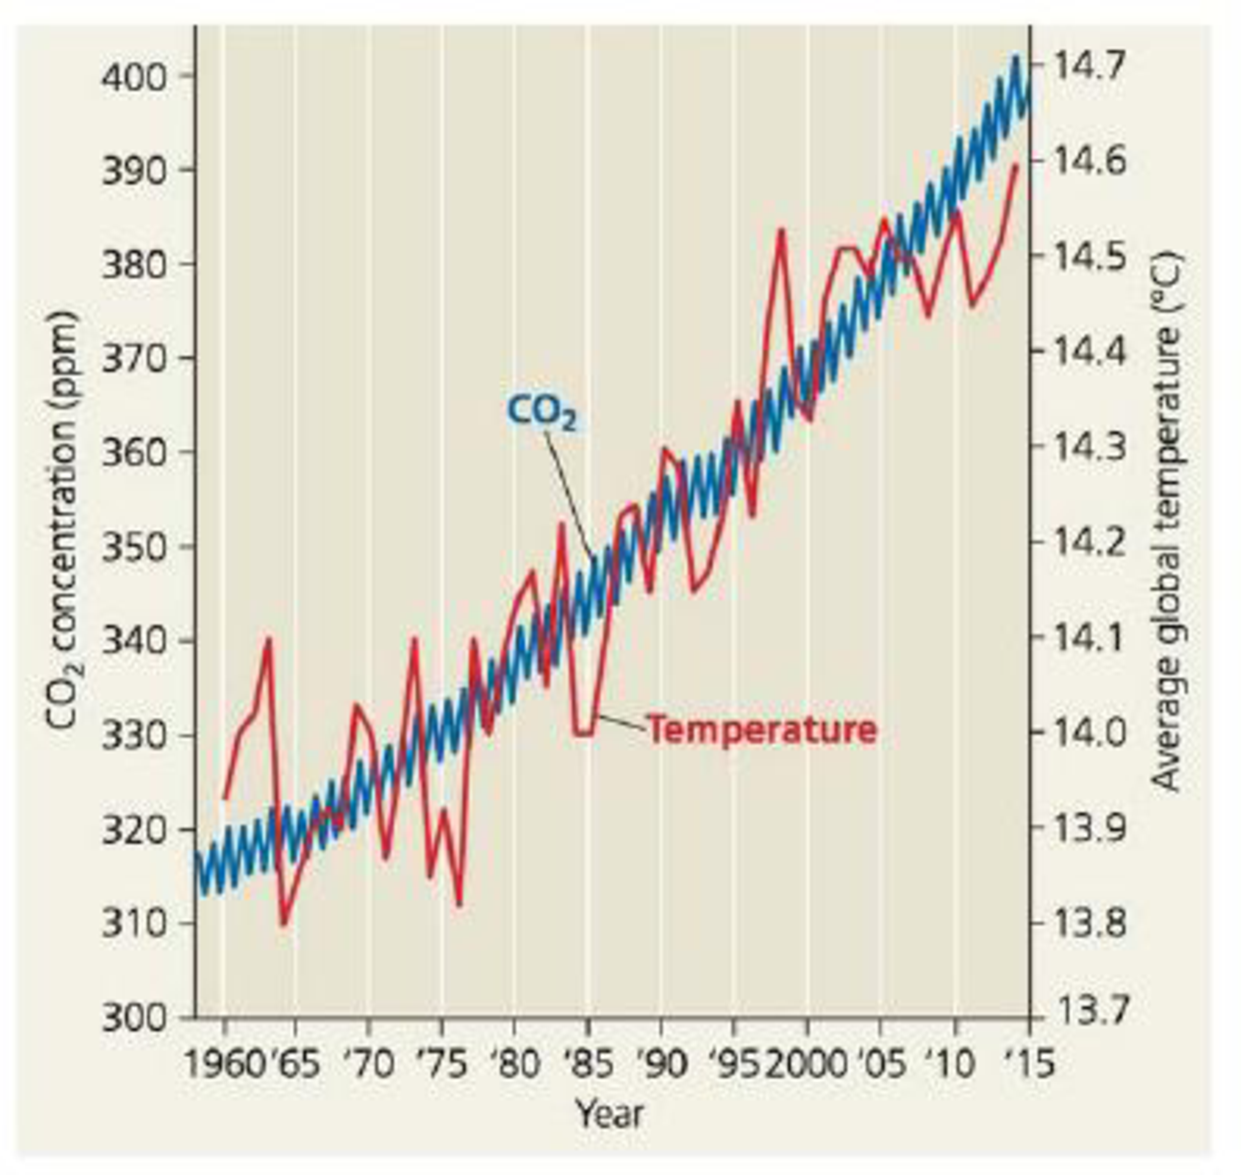
SCIENTIFIC INQUIRY (a) Estimate the average CO2. concentration in 1975 and in 2012 using data provided in Figure 56.28. (b) On average, how rapidly did CO2 concentration increase (ppm/yr) from 1975 to 2012? (c) Estimate the approximate CO2 concentration in 2100, assuming that the C02 concentration continues to rise as fast as it did from 1975 to 2012. (d) Draw a graph of average C02 concentration from 1975 to 2012 and then use a dashed line to extend the graph to the year 2100. (e) Identify the ecological factors and human decisions that might influence the actual rise in CO2. concentration. (e) Discuss how additional scientific data could help societies predict this value.
Figure 56.28 Increase in atmospheric carbon dioxide concentration at Mauna Loa, Hawaii, and average global temperatures. Aside from normal seasonal fluctuations, the CO2 concentration (blue curve) increased steadily from 1958 to 2015. Though average global temperatures (red curve) fluctuated a great deal over the same period, there is a clear warming trend.
Want to see the full answer?
Check out a sample textbook solution
Chapter 56 Solutions
Campbell Biology: Australian And New Zealand Edition + Mastering Biology With Etext


- Not part of a graded assignment, from a past midtermarrow_forwardNoggin mutation: The mouse, one of the phenotypic consequences of Noggin mutationis mispatterning of the spinal cord, in the posterior region of the mouse embryo, suchthat in the hindlimb region the more ventral fates are lost, and the dorsal Pax3 domain isexpanded. (this experiment is not in the lectures).a. Hypothesis for why: What would be your hypothesis for why the ventral fatesare lost and dorsal fates expanded? Include in your answer the words notochord,BMP, SHH and either (or both of) surface ectoderm or lateral plate mesodermarrow_forwardNot part of a graded assignment, from a past midtermarrow_forward
- Explain in a flowcharts organazing the words down below: genetics Chromosomes Inheritance DNA & Genes Mutations Proteinsarrow_forwardplease helparrow_forwardWhat does the heavy dark line along collecting duct tell us about water reabsorption in this individual at this time? What does the heavy dark line along collecting duct tell us about ADH secretion in this individual at this time?arrow_forward
 BiochemistryBiochemistryISBN:9781305577206Author:Reginald H. Garrett, Charles M. GrishamPublisher:Cengage Learning
 Comprehensive Medical Assisting: Administrative a...NursingISBN:9781305964792Author:Wilburta Q. Lindh, Carol D. Tamparo, Barbara M. Dahl, Julie Morris, Cindy CorreaPublisher:Cengage Learning
 Biology: The Unity and Diversity of Life (MindTap...BiologyISBN:9781337408332Author:Cecie Starr, Ralph Taggart, Christine Evers, Lisa StarrPublisher:Cengage Learning
 Biology 2eBiologyISBN:9781947172517Author:Matthew Douglas, Jung Choi, Mary Ann ClarkPublisher:OpenStax
 Biology: The Unity and Diversity of Life (MindTap...BiologyISBN:9781305073951Author:Cecie Starr, Ralph Taggart, Christine Evers, Lisa StarrPublisher:Cengage Learning
 Cardiopulmonary Anatomy & PhysiologyBiologyISBN:9781337794909Author:Des Jardins, Terry.Publisher:Cengage Learning,