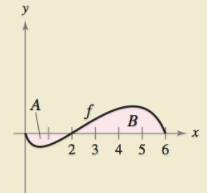
HOW DO YOU SEE IT? The graph of f is shown in the figure. The shaded region A has an area of 1.5, and ∫ 0 6 f ( x ) d x = 3.5 . Use this information to fill in the blanks. (a). ∫ 0 2 f ( x ) d x = (b). ∫ 2 6 f ( x ) d x = (c). ∫ 0 6 | f ( x ) | d x = (d). ∫ 0 2 − 2 f ( x ) d x = (e). ∫ 0 6 [ 2 + f ( x ) ] d x = (f). The average value of f over the interval [0, 6] is
HOW DO YOU SEE IT? The graph of f is shown in the figure. The shaded region A has an area of 1.5, and ∫ 0 6 f ( x ) d x = 3.5 . Use this information to fill in the blanks. (a). ∫ 0 2 f ( x ) d x = (b). ∫ 2 6 f ( x ) d x = (c). ∫ 0 6 | f ( x ) | d x = (d). ∫ 0 2 − 2 f ( x ) d x = (e). ∫ 0 6 [ 2 + f ( x ) ] d x = (f). The average value of f over the interval [0, 6] is
Solution Summary: The author illustrates how the integral is cdisplaystyleint _02f(x)dx=-3.5.
HOW DO YOU SEE IT? The graph of f is shown in the figure. The shaded region A has an area of 1.5, and
∫
0
6
f
(
x
)
d
x
=
3.5
. Use this information to fill in the blanks.
(a).
∫
0
2
f
(
x
)
d
x
=
(b).
∫
2
6
f
(
x
)
d
x
=
(c).
∫
0
6
|
f
(
x
)
|
d
x
=
(d).
∫
0
2
−
2
f
(
x
)
d
x
=
(e).
∫
0
6
[
2
+
f
(
x
)
]
d
x
=
(f). The average value of f over the interval [0, 6] is
Can you answer this question and give step by step and why and how to get it. Can you write it (numerical method)
There are three options for investing $1150. The first earns 10% compounded annually, the second earns 10% compounded quarterly, and the third earns 10% compounded continuously. Find equations that model each investment growth and
use a graphing utility to graph each model in the same viewing window over a 20-year period. Use the graph to determine which investment yields the highest return after 20 years. What are the differences in earnings among the three
investment?
STEP 1: The formula for compound interest is
A =
nt
= P(1 + − − ) n²,
where n is the number of compoundings per year, t is the number of years, r is the interest rate, P is the principal, and A is the amount (balance) after t years. For continuous compounding, the formula reduces to
A = Pert
Find r and n for each model, and use these values to write A in terms of t for each case.
Annual Model
r=0.10
A = Y(t) = 1150 (1.10)*
n = 1
Quarterly Model
r = 0.10
n = 4
A = Q(t) = 1150(1.025) 4t
Continuous Model
r=0.10
A = C(t) =…
Use a graphing utility to find the point of intersection, if any, of the graphs of the functions. Round your result to three decimal places. (Enter NONE in any unused answer blanks.)
y = 100e0.01x
(x, y) =
y = 11,250
×
Need a deep-dive on the concept behind this application? Look no further. Learn more about this topic, calculus and related others by exploring similar questions and additional content below.


 Algebra & Trigonometry with Analytic GeometryAlgebraISBN:9781133382119Author:SwokowskiPublisher:Cengage
 College Algebra (MindTap Course List)AlgebraISBN:9781305652231Author:R. David Gustafson, Jeff HughesPublisher:Cengage Learning
 Algebra: Structure And Method, Book 1AlgebraISBN:9780395977224Author:Richard G. Brown, Mary P. Dolciani, Robert H. Sorgenfrey, William L. ColePublisher:McDougal Littell
 Algebra and Trigonometry (MindTap Course List)AlgebraISBN:9781305071742Author:James Stewart, Lothar Redlin, Saleem WatsonPublisher:Cengage Learning