
Concept explainers
Videos
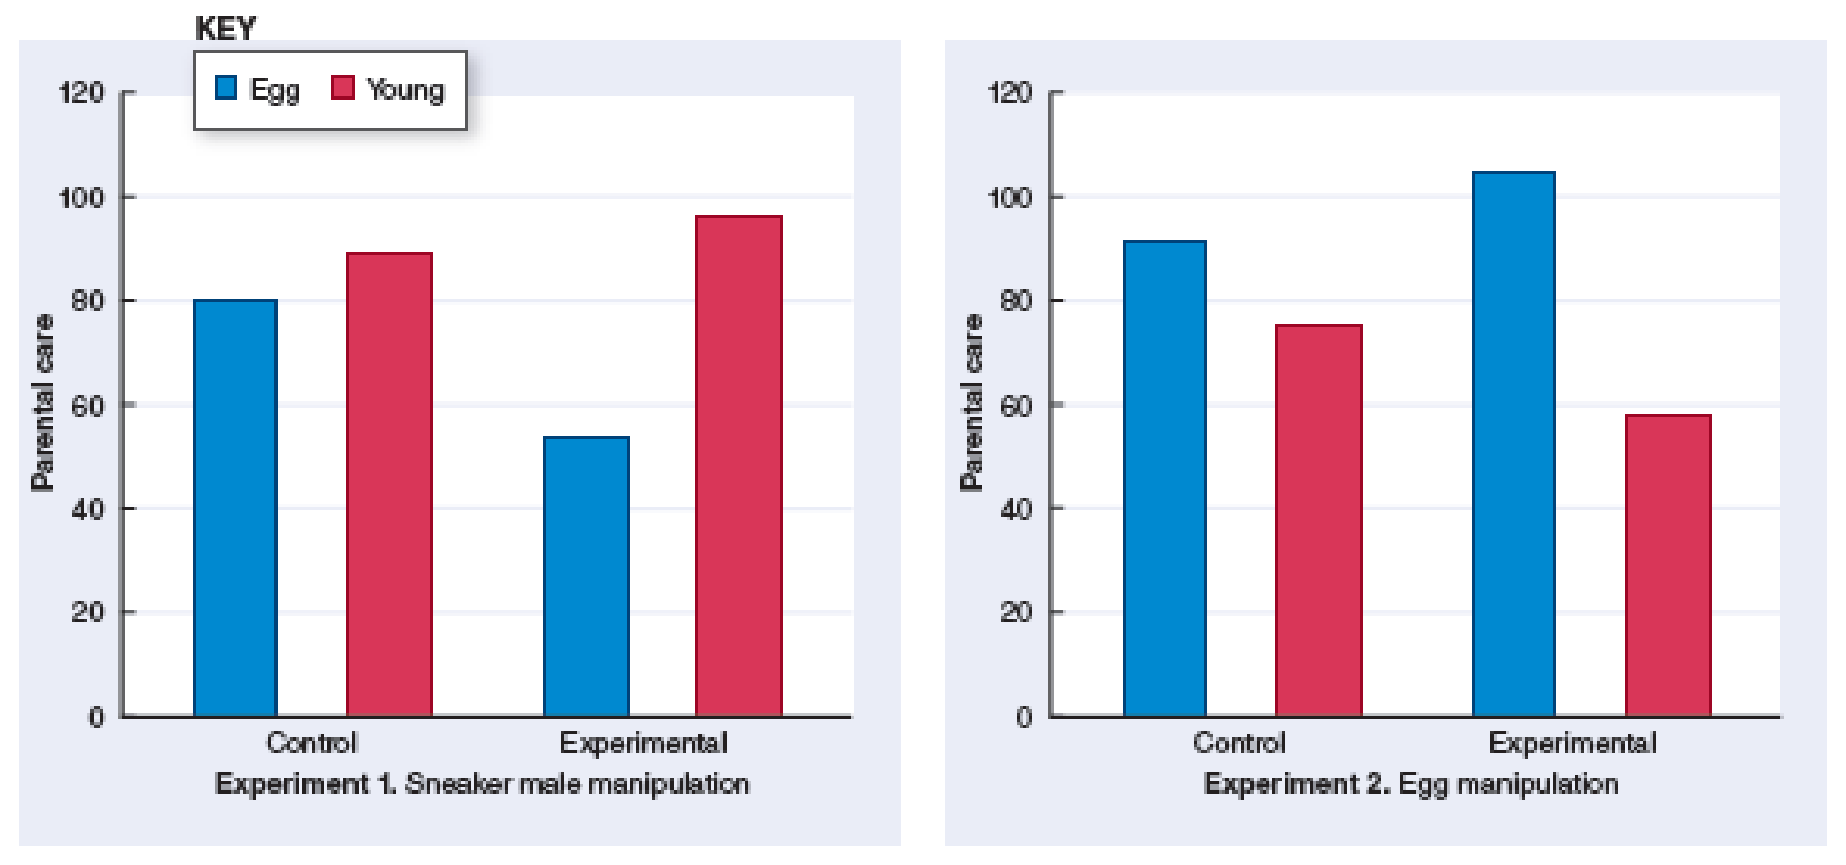
INTERPRET DATA Look at the two graphs in Figure 52-21. In which experiment did the parentals in the experimental group guard the eggs more closely? In which experiment did the experimental parentals guard the young more closely? Account for these differences.
RESULTS:
Experiment 1: As indicated on the y-axis, which measures level of parental care, parentals reduced their level of guarding the eggs. Eight of the males in the experimental group abandoned their nests, and egg defense was significantly lower in this group compared with that in the control group. However, after eggs hatched, there was little difference in parental care of the young between the two groups.
Experiment 2: During the egg phase, there was little difference in level of parental care between experimental and control groups. However, after eggs hatched, the experimental parentals significantly decreased their level of guarding the nest.
CONCLUSION: Male bluegill sunfish adjust their level of parental care according to their level of perceived paternity.
In Experiment 1, parentals provided less care when they perceived that the eggs may have been fertilized by sneaker males. After the eggs hatched, olfactory cues indicated that the offspring were indeed their own, and their level of care increased.
In Experiment 2, parentals cared for the eggs even though some had been swapped. However, after they hatched, olfactory cues from the offspring indicated that they were not the parental’s own offspring. The level of parental care decreased significantly.
SOURCE: B.D. Neff, Nature, Vol. 422 (April 17, 2003): 716–719.
Figure 52-21 Decisions about parental care
Want to see the full answer?
Check out a sample textbook solution
Chapter 52 Solutions
BIOLOGY LL VERSION + MINDTAP V2.0(2 TER


- Ch.23 How is Salmonella able to cross from the intestines into the blood? A. it is so small that it can squeeze between intestinal cells B. it secretes a toxin that induces its uptake into intestinal epithelial cells C. it secretes enzymes that create perforations in the intestine D. it can get into the blood only if the bacteria are deposited directly there, that is, through a puncture — Which virus is associated with liver cancer? A. hepatitis A B. hepatitis B C. hepatitis C D. both hepatitis B and C — explain your answer thoroughlyarrow_forwardCh.21 What causes patients infected with the yellow fever virus to turn yellow (jaundice)? A. low blood pressure and anemia B. excess leukocytes C. alteration of skin pigments D. liver damage in final stage of disease — What is the advantage for malarial parasites to grow and replicate in red blood cells? A. able to spread quickly B. able to avoid immune detection C. low oxygen environment for growth D. cooler area of the body for growth — Which microbe does not live part of its lifecycle outside humans? A. Toxoplasma gondii B. Cytomegalovirus C. Francisella tularensis D. Plasmodium falciparum — explain your answer thoroughlyarrow_forwardCh.22 Streptococcus pneumoniae has a capsule to protect it from killing by alveolar macrophages, which kill bacteria by… A. cytokines B. antibodies C. complement D. phagocytosis — What fact about the influenza virus allows the dramatic antigenic shift that generates novel strains? A. very large size B. enveloped C. segmented genome D. over 100 genes — explain your answer thoroughlyarrow_forward
- What is this?arrow_forwardMolecular Biology A-C components of the question are corresponding to attached image labeled 1. D component of the question is corresponding to attached image labeled 2. For a eukaryotic mRNA, the sequences is as follows where AUGrepresents the start codon, the yellow is the Kozak sequence and (XXX) just represents any codonfor an amino acid (no stop codons here). G-cap and polyA tail are not shown A. How long is the peptide produced?B. What is the function (a sentence) of the UAA highlighted in blue?C. If the sequence highlighted in blue were changed from UAA to UAG, how would that affecttranslation? D. (1) The sequence highlighted in yellow above is moved to a new position indicated below. Howwould that affect translation? (2) How long would be the protein produced from this new mRNA? Thank youarrow_forwardMolecular Biology Question Explain why the cell doesn’t need 61 tRNAs (one for each codon). Please help. Thank youarrow_forward
- Molecular Biology You discover a disease causing mutation (indicated by the arrow) that alters splicing of its mRNA. This mutation (a base substitution in the splicing sequence) eliminates a 3’ splice site resulting in the inclusion of the second intron (I2) in the final mRNA. We are going to pretend that this intron is short having only 15 nucleotides (most introns are much longer so this is just to make things simple) with the following sequence shown below in bold. The ( ) indicate the reading frames in the exons; the included intron 2 sequences are in bold. A. Would you expected this change to be harmful? ExplainB. If you were to do gene therapy to fix this problem, briefly explain what type of gene therapy youwould use to correct this. Please help. Thank youarrow_forwardMolecular Biology Question Please help. Thank you Explain what is meant by the term “defective virus.” Explain how a defective virus is able to replicate.arrow_forwardMolecular Biology Explain why changing the codon GGG to GGA should not be harmful. Please help . Thank youarrow_forward
- Stage Percent Time in Hours Interphase .60 14.4 Prophase .20 4.8 Metaphase .10 2.4 Anaphase .06 1.44 Telophase .03 .72 Cytukinesis .01 .24 Can you summarize the results in the chart and explain which phases are faster and why the slower ones are slow?arrow_forwardCan you circle a cell in the different stages of mitosis? 1.prophase 2.metaphase 3.anaphase 4.telophase 5.cytokinesisarrow_forwardWhich microbe does not live part of its lifecycle outside humans? A. Toxoplasma gondii B. Cytomegalovirus C. Francisella tularensis D. Plasmodium falciparum explain your answer thoroughly.arrow_forward
 Biology (MindTap Course List)BiologyISBN:9781337392938Author:Eldra Solomon, Charles Martin, Diana W. Martin, Linda R. BergPublisher:Cengage Learning
 Biology Today and Tomorrow without Physiology (Mi...BiologyISBN:9781305117396Author:Cecie Starr, Christine Evers, Lisa StarrPublisher:Cengage Learning
 Human Heredity: Principles and Issues (MindTap Co...BiologyISBN:9781305251052Author:Michael CummingsPublisher:Cengage Learning
 Biology: The Dynamic Science (MindTap Course List)BiologyISBN:9781305389892Author:Peter J. Russell, Paul E. Hertz, Beverly McMillanPublisher:Cengage Learning