
Concept explainers
Videos
Radioactive Decay A sample of radioactive material decays over time (measured in hours) with decay constant
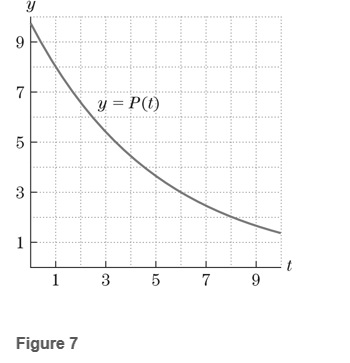
a. How much was remaining after
b. Approximate the half-life of the material.
c. How fast was the sample decaying after
d. When was the sample decaying at the rate of
Want to see the full answer?
Check out a sample textbook solution
Chapter 5 Solutions
Calculus & Its Applications


- Let E be the region bounded cone z = √√/6 - (x² + y²) and the sphere z = x² + y² + z² . Provide an answer accurate to at least 4 significant digits. Find the volume of E. Triple Integral Spherical Coordinates Cutout of sphere is for visual purposes 0.8- 0.6 z 04 0.2- 0- -0.4 -0.2 04 0 0.2 0.2 x -0.2 04 -0.4 Note: The graph is an example. The scale and equation parameters may not be the same for your particular problem. Round your answer to 4 decimal places. Hint: Solve the cone equation for phi. * Oops - try again.arrow_forwardThe temperature at a point (x,y,z) of a solid E bounded by the coordinate planes and the plane 9.x+y+z = 1 is T(x, y, z) = (xy + 8z +20) degrees Celcius. Find the average temperature over the solid. (Answer to 4 decimal places). Average Value of a function using 3 variables z 1- y Hint: y = -a·x+1 * Oops - try again. xarrow_forwardFind the saddle pointsarrow_forward
- For the curve defined by r(t) = (e** cos(t), et sin(t)) find the unit tangent vector, unit normal vector, normal acceleration, and tangential acceleration at t = πT 3 T (1) N Ň (1) 133 | aN = 53 ar = = =arrow_forwardFind the tangential and normal components of the acceleration vector for the curve - F(t) = (2t, −3t³, −3+¹) at the point t = 1 - ā(1) = T + Ñ Give your answers to two decimal placesarrow_forwardFind the unit tangent vector to the curve defined by (t)=(-2t,-4t, √√49 - t²) at t = −6. T(−6) =arrow_forward
- An airplane flies due west at an airspeed of 428 mph. The wind blows in the direction of 41° south of west at 50 mph. What is the ground speed of the airplane? What is the bearing of the airplane? 428 mph 41° 50 mph a. The ground speed of the airplane is b. The bearing of the airplane is mph. south of west.arrow_forwardRylee's car is stuck in the mud. Roman and Shanice come along in a truck to help pull her out. They attach one end of a tow strap to the front of the car and the other end to the truck's trailer hitch, and the truck starts to pull. Meanwhile, Roman and Shanice get behind the car and push. The truck generates a horizontal force of 377 lb on the car. Roman and Shanice are pushing at a slight upward angle and generate a force of 119 lb on the car. These forces can be represented by vectors, as shown in the figure below. The angle between these vectors is 20.2°. Find the resultant force (the vector sum), then give its magnitude and its direction angle from the positive x-axis. 119 lb 20.2° 377 lb a. The resultant force is (Tip: omit degree notations from your answers; e.g. enter cos(45) instead of cos(45°)) b. It's magnitude is lb. c. It's angle from the positive x-axis isarrow_forwardFind a plane containing the point (3, -3, 1) and the line of intersection of the planes 2x + 3y - 3z = 14 and -3x - y + z = −21. The equation of the plane is:arrow_forward
- Determine whether the lines L₁ : F(t) = (−2, 3, −1)t + (0,2,-3) and L2 : ƒ(s) = (2, −3, 1)s + (−10, 17, -8) intersect. If they do, find the point of intersection. ● They intersect at the point They are skew lines They are parallel or equalarrow_forwardAnswer questions 2arrow_forwardHow does a fourier transform works?arrow_forward

 Algebra and Trigonometry (MindTap Course List)AlgebraISBN:9781305071742Author:James Stewart, Lothar Redlin, Saleem WatsonPublisher:Cengage Learning
 College AlgebraAlgebraISBN:9781305115545Author:James Stewart, Lothar Redlin, Saleem WatsonPublisher:Cengage Learning
 Glencoe Algebra 1, Student Edition, 9780079039897...AlgebraISBN:9780079039897Author:CarterPublisher:McGraw Hill
 Algebra & Trigonometry with Analytic GeometryAlgebraISBN:9781133382119Author:SwokowskiPublisher:Cengage