MyLab Statistics with Pearson eText -- Standalone Access Card -- for Essentials of Statistics
6th Edition
ISBN: 9780134870113
Author: Mario F. Triola
Publisher: PEARSON
expand_more
expand_more
format_list_bulleted
Concept explainers
Videos
Textbook Question
Chapter 5.1, Problem 1BSC
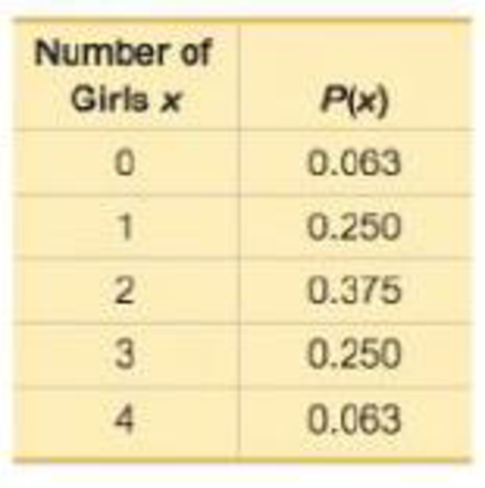
Random Variable The accompanying table lists probabilities for the corresponding numbers of girls in four births. What is the random variable, what are its possible values, and are its values numerical?
Number of Girls in Four Births
Expert Solution & Answer

Learn your wayIncludes step-by-step video

schedule01:48
Students have asked these similar questions
Business discuss
Business discuss
I just need to know why this is wrong below:
What is the test statistic W? W=5 (incorrect)
and
What is the p-value of this test? (p-value < 0.001-- incorrect)
Use the Wilcoxon signed rank test to test the hypothesis that the median number of pages in the statistics books in the library from which the sample was taken is 400. A sample of 12 statistics books have the following numbers of pages
pages
127
217
486
132
397
297
396
327
292
256
358
272
What is the sum of the negative ranks (W-)? 75 What is the sum of the positive ranks (W+)? 5What type of test is this? two tailedWhat is the test statistic W? 5 These are the critical values for a 1-tailed Wilcoxon Signed Rank test for n=12
Alpha Level
0.001
0.005
0.01
0.025
0.05
0.1
0.2
Critical Value
75
70
68
64
60
56
50
What is the p-value for this test? p-value < 0.001
Chapter 5 Solutions
MyLab Statistics with Pearson eText -- Standalone Access Card -- for Essentials of Statistics
Ch. 5.1 - Random Variable The accompanying table lists...Ch. 5.1 - Discrete or Continuous? Is the random variable...Ch. 5.1 - Probability Distribution For the accompanying...Ch. 5.1 - Significant For 100 births, P(exactly 56 girls) =...Ch. 5.1 - Identifying Discrete and Continuous Random...Ch. 5.1 - Identifying Discrete and Continuous Random...Ch. 5.1 - Identifying Probability Distributions. In...Ch. 5.1 - Identifying Probability Distributions. In...Ch. 5.1 - Identifying Probability Distributions. In...Ch. 5.1 - Identifying Probability Distributions. In...
Ch. 5.1 - Identifying Probability Distributions. In...Ch. 5.1 - Identifying Probability Distributions. In...Ch. 5.1 - Identifying Probability Distributions. In...Ch. 5.1 - Identifying Probability Distributions. In...Ch. 5.1 - Genetics. In Exercises 1520, refer to the...Ch. 5.1 - Genetics. In Exercises 1520, refer to the...Ch. 5.1 - Genetics. In Exercises 1520, refer to the...Ch. 5.1 - Genetics. In Exercises 1520, refer to the...Ch. 5.1 - Genetics. In Exercises 1520, refer to the...Ch. 5.1 - Genetics. In Exercises 1520, refer to the...Ch. 5.1 - Sleepwalking. In Exercises 2125, refer to the...Ch. 5.1 - Sleepwalking. In Exercises 2125, refer to the...Ch. 5.1 - Sleepwalking. In Exercises 2125, refer to the...Ch. 5.1 - Sleepwalking. In Exercises 2125, refer to the...Ch. 5.1 - Sleepwalking. In Exercises 2125, refer to the...Ch. 5.1 - Expected Value for the Ohio Pick 4 Lottery In the...Ch. 5.1 - Expected Value in Virginias Pick 3 Game In...Ch. 5.1 - Expected Value in Roulette When playing roulette...Ch. 5.1 - Expected Value for Life Insurance There is a...Ch. 5.1 - Expected Value for Life Insurance There is a...Ch. 5.2 - Drone Deliveries Based on a Pitney Bowes survey,...Ch. 5.2 - Notation Assume that we want to find the...Ch. 5.2 - Independent Events Based on a Pitney Bowes survey,...Ch. 5.2 - Notation of 0 + Using the same survey from...Ch. 5.2 - Identifying Binomial Distributions. In Exercises...Ch. 5.2 - Identifying Binomial Distributions. In Exercises...Ch. 5.2 - Identifying Binomial Distributions. In Exercises...Ch. 5.2 - Identifying Binomial Distributions. In Exercises...Ch. 5.2 - Identifying Binomial Distributions. In Exercises...Ch. 5.2 - Identifying Binomial Distributions. In Exercises...Ch. 5.2 - Identifying Binomial Distributions. In Exercises...Ch. 5.2 - Identifying Binomial Distributions. In Exercises...Ch. 5.2 - Binomial Probability Formula. In Exercises 13 and...Ch. 5.2 - News Source Based on data from a Harris...Ch. 5.2 - SAT Test. In Exercises 1520, assume that random...Ch. 5.2 - SAT Test. In Exercises 1520, assume that random...Ch. 5.2 - SAT Test. In Exercises 1520, assume that random...Ch. 5.2 - SAT Test. In Exercises 1520, assume that random...Ch. 5.2 - SAT Test. In Exercises 1520, assume that random...Ch. 5.2 - SAT Test. In Exercises 1520, assume that random...Ch. 5.2 - In Exercises 2124, assume that when adults with...Ch. 5.2 - In Exercises 2124, assume that when adults with...Ch. 5.2 - In Exercises 2124, assume that when adults with...Ch. 5.2 - In Exercises 2124, assume that when adults with...Ch. 5.2 - Whitus v. Georgia In the classic legal case of...Ch. 5.2 - Vision Correction A survey sponsored by the Vision...Ch. 5.2 - See You Later Based on a Harris Interactive poll,...Ch. 5.2 - Too Young to Tat Based on a Harris poll, among...Ch. 5.2 - Significance with Range Rule of Thumb. In...Ch. 5.2 - Significance with Range Rule of Thumb. In...Ch. 5.2 - Significance with Range Rule of Thumb. In...Ch. 5.2 - Hybrids Assume that offspring peas are randomly...Ch. 5.2 - Composite Sampling. Exercises 33 and 34 involve...Ch. 5.2 - Anemia Based on data from Bloodjournal.org, 10% of...Ch. 5.2 - Acceptance Sampling. Exercises 35 and 36 involve...Ch. 5.2 - AAA Batteries AAA batteries are made by companies...Ch. 5.2 - MMs Data Set 27 MM Weights in Appendix B includes...Ch. 5.2 - Politics The County Clerk in Essex, New Jersey,...Ch. 5.2 - Perception and Reality In a presidential election,...Ch. 5.2 - Hybrids One of Mendels famous experiments with...Ch. 5.2 - Geometric Distribution If a procedure meets all...Ch. 5.2 - Multinomial Distribution The binomial distribution...Ch. 5.2 - Hypergeometric Distribution If we sample from a...Ch. 5.3 - Notation In analyzing hits by V-1 buzz bombs in...Ch. 5.3 - Tornadoes During a recent 64-year period, New...Ch. 5.3 - Poisson Probability Distribution The random...Ch. 5.3 - Probability if 0 For Formula 5-9, what does P(0)...Ch. 5.3 - Hurricanes. In Exercises 58, assume that the...Ch. 5.3 - Hurricanes a. Find the probability that in a year,...Ch. 5.3 - Hurricanes a. Find the probability that in a year,...Ch. 5.3 - Hurricanes a. Find the probability that in a year,...Ch. 5.3 - In Exercises 916, use the Poisson distribution to...Ch. 5.3 - Murders In a recent year, there were 333 murders...Ch. 5.3 - Radioactive Decay Radioactive atoms are unstable...Ch. 5.3 - Deaths from Horse Kicks A classical example of the...Ch. 5.3 - World War II Bombs In Exercise 1Notation we noted...Ch. 5.3 - Disease Cluster Neuroblastoma, a rare form of...Ch. 5.3 - Car Fatalities The recent rate of car fatalities...Ch. 5.3 - Checks In a recent year, the author wrote 181...Ch. 5.3 - Powerball: Poisson Approximation to Binomial There...Ch. 5 - Is a probability distribution defined if the only...Ch. 5 - There are 80 questions from an SAT test, and they...Ch. 5 - Are the values Found in Exercise 2 statistics or...Ch. 5 - Using the same SAT questions described in Exercise...Ch. 5 - Using the same SAT questions described in Exercise...Ch. 5 - In Exercises 610, use the following: Five American...Ch. 5 - In Exercises 610, use the following: Five American...Ch. 5 - Based on the table, the standard deviation is 0.9...Ch. 5 - 9. What does the probability of 0+ indicate? Does...Ch. 5 - In Exercises 6-10, use the following: Five...Ch. 5 - In Exercises 15, assume that 74% of randomly...Ch. 5 - In Exercises 15, assume that 74% of randomly...Ch. 5 - In Exercises 15, assume that 74% of randomly...Ch. 5 - In Exercises 15, assume that 74% of randomly...Ch. 5 - In Exercises 15, assume that 74% of randomly...Ch. 5 - Security Survey In a USA Today poll, subjects were...Ch. 5 - Brand Recognition In a study of brand recognition...Ch. 5 - Family/Partner Groups of people aged 1565 are...Ch. 5 - Detecting Fraud The Brooklyn District Attorneys...Ch. 5 - Poisson: Deaths Currently, an average of 7...Ch. 5 - Planets The planets of the solar system have the...Ch. 5 - South Carolina Pick 3 In South Carolinas Pick 3...Ch. 5 - Tennis Challenge In a recent U.S. Open tennis...Ch. 5 - Job Applicants The Society for Human Resource...Ch. 5 - Bar Graph Fox News broadcast a graph similar to...Ch. 5 - Washing Hands Based on results from a Bradley...Ch. 5 - Overbooking Flights American Airlines Flight 171...Ch. 5 - Critical Thinking: Did Mendels results from plant...
Additional Math Textbook Solutions
Find more solutions based on key concepts
8. Effect of Blinding Among 13,200 submitted abstracts that were blindly evaluated (with authors and institutio...
Elementary Statistics
Matching In Exercises 17–20, match the level of confidence c with the appropriate confidence interval. Assume e...
Elementary Statistics: Picturing the World (7th Edition)
Choose your test Use the test of your choice to determine whether the following series converge. 49. k=31lnk
Calculus: Early Transcendentals (2nd Edition)
Whether 22 is prime or composite number.
Pre-Algebra Student Edition
Fill in each blanks so that the resulting statement is true. Any set of ordered pairs is called a/an _______. T...
College Algebra (7th Edition)
Knowledge Booster


Learn more about
Need a deep-dive on the concept behind this application? Look no further. Learn more about this topic, statistics and related others by exploring similar questions and additional content below.Similar questions
- ons 12. A sociologist hypothesizes that the crime rate is higher in areas with higher poverty rate and lower median income. She col- lects data on the crime rate (crimes per 100,000 residents), the poverty rate (in %), and the median income (in $1,000s) from 41 New England cities. A portion of the regression results is shown in the following table. Standard Coefficients error t stat p-value Intercept -301.62 549.71 -0.55 0.5864 Poverty 53.16 14.22 3.74 0.0006 Income 4.95 8.26 0.60 0.5526 a. b. Are the signs as expected on the slope coefficients? Predict the crime rate in an area with a poverty rate of 20% and a median income of $50,000. 3. Using data from 50 workarrow_forward2. The owner of several used-car dealerships believes that the selling price of a used car can best be predicted using the car's age. He uses data on the recent selling price (in $) and age of 20 used sedans to estimate Price = Po + B₁Age + ε. A portion of the regression results is shown in the accompanying table. Standard Coefficients Intercept 21187.94 Error 733.42 t Stat p-value 28.89 1.56E-16 Age -1208.25 128.95 -9.37 2.41E-08 a. What is the estimate for B₁? Interpret this value. b. What is the sample regression equation? C. Predict the selling price of a 5-year-old sedan.arrow_forwardian income of $50,000. erty rate of 13. Using data from 50 workers, a researcher estimates Wage = Bo+B,Education + B₂Experience + B3Age+e, where Wage is the hourly wage rate and Education, Experience, and Age are the years of higher education, the years of experience, and the age of the worker, respectively. A portion of the regression results is shown in the following table. ni ogolloo bash 1 Standard Coefficients error t stat p-value Intercept 7.87 4.09 1.93 0.0603 Education 1.44 0.34 4.24 0.0001 Experience 0.45 0.14 3.16 0.0028 Age -0.01 0.08 -0.14 0.8920 a. Interpret the estimated coefficients for Education and Experience. b. Predict the hourly wage rate for a 30-year-old worker with four years of higher education and three years of experience.arrow_forward
- 1. If a firm spends more on advertising, is it likely to increase sales? Data on annual sales (in $100,000s) and advertising expenditures (in $10,000s) were collected for 20 firms in order to estimate the model Sales = Po + B₁Advertising + ε. A portion of the regression results is shown in the accompanying table. Intercept Advertising Standard Coefficients Error t Stat p-value -7.42 1.46 -5.09 7.66E-05 0.42 0.05 8.70 7.26E-08 a. Interpret the estimated slope coefficient. b. What is the sample regression equation? C. Predict the sales for a firm that spends $500,000 annually on advertising.arrow_forwardCan you help me solve problem 38 with steps im stuck.arrow_forwardHow do the samples hold up to the efficiency test? What percentages of the samples pass or fail the test? What would be the likelihood of having the following specific number of efficiency test failures in the next 300 processors tested? 1 failures, 5 failures, 10 failures and 20 failures.arrow_forward
- The battery temperatures are a major concern for us. Can you analyze and describe the sample data? What are the average and median temperatures? How much variability is there in the temperatures? Is there anything that stands out? Our engineers’ assumption is that the temperature data is normally distributed. If that is the case, what would be the likelihood that the Safety Zone temperature will exceed 5.15 degrees? What is the probability that the Safety Zone temperature will be less than 4.65 degrees? What is the actual percentage of samples that exceed 5.25 degrees or are less than 4.75 degrees? Is the manufacturing process producing units with stable Safety Zone temperatures? Can you check if there are any apparent changes in the temperature pattern? Are there any outliers? A closer look at the Z-scores should help you in this regard.arrow_forwardNeed help pleasearrow_forwardPlease conduct a step by step of these statistical tests on separate sheets of Microsoft Excel. If the calculations in Microsoft Excel are incorrect, the null and alternative hypotheses, as well as the conclusions drawn from them, will be meaningless and will not receive any points. 4. One-Way ANOVA: Analyze the customer satisfaction scores across four different product categories to determine if there is a significant difference in means. (Hints: The null can be about maintaining status-quo or no difference among groups) H0 = H1=arrow_forward
- Please conduct a step by step of these statistical tests on separate sheets of Microsoft Excel. If the calculations in Microsoft Excel are incorrect, the null and alternative hypotheses, as well as the conclusions drawn from them, will be meaningless and will not receive any points 2. Two-Sample T-Test: Compare the average sales revenue of two different regions to determine if there is a significant difference. (Hints: The null can be about maintaining status-quo or no difference among groups; if alternative hypothesis is non-directional use the two-tailed p-value from excel file to make a decision about rejecting or not rejecting null) H0 = H1=arrow_forwardPlease conduct a step by step of these statistical tests on separate sheets of Microsoft Excel. If the calculations in Microsoft Excel are incorrect, the null and alternative hypotheses, as well as the conclusions drawn from them, will be meaningless and will not receive any points 3. Paired T-Test: A company implemented a training program to improve employee performance. To evaluate the effectiveness of the program, the company recorded the test scores of 25 employees before and after the training. Determine if the training program is effective in terms of scores of participants before and after the training. (Hints: The null can be about maintaining status-quo or no difference among groups; if alternative hypothesis is non-directional, use the two-tailed p-value from excel file to make a decision about rejecting or not rejecting the null) H0 = H1= Conclusion:arrow_forwardPlease conduct a step by step of these statistical tests on separate sheets of Microsoft Excel. If the calculations in Microsoft Excel are incorrect, the null and alternative hypotheses, as well as the conclusions drawn from them, will be meaningless and will not receive any points. The data for the following questions is provided in Microsoft Excel file on 4 separate sheets. Please conduct these statistical tests on separate sheets of Microsoft Excel. If the calculations in Microsoft Excel are incorrect, the null and alternative hypotheses, as well as the conclusions drawn from them, will be meaningless and will not receive any points. 1. One Sample T-Test: Determine whether the average satisfaction rating of customers for a product is significantly different from a hypothetical mean of 75. (Hints: The null can be about maintaining status-quo or no difference; If your alternative hypothesis is non-directional (e.g., μ≠75), you should use the two-tailed p-value from excel file to…arrow_forward
arrow_back_ios
SEE MORE QUESTIONS
arrow_forward_ios
Recommended textbooks for you

 Holt Mcdougal Larson Pre-algebra: Student Edition...AlgebraISBN:9780547587776Author:HOLT MCDOUGALPublisher:HOLT MCDOUGAL
 Algebra and Trigonometry (MindTap Course List)AlgebraISBN:9781305071742Author:James Stewart, Lothar Redlin, Saleem WatsonPublisher:Cengage Learning
 College AlgebraAlgebraISBN:9781305115545Author:James Stewart, Lothar Redlin, Saleem WatsonPublisher:Cengage Learning
 College Algebra (MindTap Course List)AlgebraISBN:9781305652231Author:R. David Gustafson, Jeff HughesPublisher:Cengage Learning
Holt Mcdougal Larson Pre-algebra: Student Edition...
Algebra
ISBN:9780547587776
Author:HOLT MCDOUGAL
Publisher:HOLT MCDOUGAL
Algebra and Trigonometry (MindTap Course List)
Algebra
ISBN:9781305071742
Author:James Stewart, Lothar Redlin, Saleem Watson
Publisher:Cengage Learning
College Algebra
Algebra
ISBN:9781305115545
Author:James Stewart, Lothar Redlin, Saleem Watson
Publisher:Cengage Learning
College Algebra (MindTap Course List)
Algebra
ISBN:9781305652231
Author:R. David Gustafson, Jeff Hughes
Publisher:Cengage Learning
Mod-01 Lec-01 Discrete probability distributions (Part 1); Author: nptelhrd;https://www.youtube.com/watch?v=6x1pL9Yov1k;License: Standard YouTube License, CC-BY
Discrete Probability Distributions; Author: Learn Something;https://www.youtube.com/watch?v=m9U4UelWLFs;License: Standard YouTube License, CC-BY
Probability Distribution Functions (PMF, PDF, CDF); Author: zedstatistics;https://www.youtube.com/watch?v=YXLVjCKVP7U;License: Standard YouTube License, CC-BY
Discrete Distributions: Binomial, Poisson and Hypergeometric | Statistics for Data Science; Author: Dr. Bharatendra Rai;https://www.youtube.com/watch?v=lHhyy4JMigg;License: Standard Youtube License