Reading Habits In 2016 the Pew Research Center asked a sample of American adults which of the following they had done in the previous 12 months: read a book in any format, read a print book, read an e-book, and listened to an audio book. The percentages of who had engaged in each of these activities is shown in the table. Suppose Pew Research Center did another survey polling 1200 people and the percentages were the same as those in 2016. a. How many would have read a book in any format? b. How many would have read an e-book? c. Are the events listed in the table mutually exclusive? Why or why not?
Reading Habits In 2016 the Pew Research Center asked a sample of American adults which of the following they had done in the previous 12 months: read a book in any format, read a print book, read an e-book, and listened to an audio book. The percentages of who had engaged in each of these activities is shown in the table. Suppose Pew Research Center did another survey polling 1200 people and the percentages were the same as those in 2016. a. How many would have read a book in any format? b. How many would have read an e-book? c. Are the events listed in the table mutually exclusive? Why or why not?
Solution Summary: The author explains that the reading habits of U.S. adults are categorized into four categories, one of which includes reading a book in print and e-book formats.
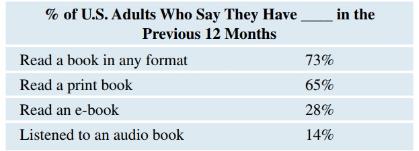
Reading Habits In 2016 the Pew Research Center asked a sample of American adults which of the following they had done in the previous 12 months: read a book in any format, read a print book, read an e-book, and listened to an audio book. The percentages of who had engaged in each of these activities is shown in the table.
Suppose Pew Research Center did another survey polling 1200 people and the percentages were the same as those in 2016.
a. How many would have read a book in any format?
b. How many would have read an e-book?
c. Are the events listed in the table mutually exclusive? Why or why not?
NC Current Students - North Ce X | NC Canvas Login Links - North ( X
Final Exam Comprehensive x Cengage Learning
x
WASTAT - Final Exam - STAT
→
C
webassign.net/web/Student/Assignment-Responses/submit?dep=36055360&tags=autosave#question3659890_9
Part (b)
Draw a scatter plot of the ordered pairs.
N
Life
Expectancy
Life
Expectancy
80
70
600
50
40
30
20
10
Year of
1950
1970 1990
2010 Birth
O
Life
Expectancy
Part (c)
800
70
60
50
40
30
20
10
1950
1970 1990
W
ALT
林
$
#
4
R
J7
Year of
2010 Birth
F6
4+
80
70
60
50
40
30
20
10
Year of
1950 1970 1990
2010 Birth
Life
Expectancy
Ox
800
70
60
50
40
30
20
10
Year of
1950 1970 1990 2010 Birth
hp
P.B.
KA
&
7
80
% 5
H
A
B
F10
711
N
M
K
744
PRT SC
ALT
CTRL
Need a deep-dive on the concept behind this application? Look no further. Learn more about this topic, statistics and related others by exploring similar questions and additional content below.
MFCS unit-1 || Part:1 || JNTU || Well formed formula || propositional calculus || truth tables; Author: Learn with Smily;https://www.youtube.com/watch?v=XV15Q4mCcHc;License: Standard YouTube License, CC-BY


 Glencoe Algebra 1, Student Edition, 9780079039897...AlgebraISBN:9780079039897Author:CarterPublisher:McGraw Hill
 Holt Mcdougal Larson Pre-algebra: Student Edition...AlgebraISBN:9780547587776Author:HOLT MCDOUGALPublisher:HOLT MCDOUGAL
 Big Ideas Math A Bridge To Success Algebra 1: Stu...AlgebraISBN:9781680331141Author:HOUGHTON MIFFLIN HARCOURTPublisher:Houghton Mifflin Harcourt