Concept explainers
Videos
Contribution margin, break-even sales, cost-volume-profit chart, margin of safety, and operating leverage
Belmain Co. expects to maintain the same inventories at the end of 20Y7 as at the beginning of the year. The total of all production costs for the year is therefore assumed to be equal to the cost of goods sold. With this in mind, the various department heads were asked to submit estimates of the costs for their departments during the year. A summary report of these estimates is as follows:

It is expected that 12,000 units will be sold at a price of $240 a unit. Maximum sales within the relevant range are 18,000 units.
Instructions
- 1. Prepare an estimated income statement for 20Y7.
- 2. What is the expected contribution margin ratio?
- 3. Determine the break-even sales in units and dollars.
- 4. Construct a cost-volume-profit chart indicating the break-even sales.
- 5. What is the expected margin of safety in dollars and as a percentage of sales? (Round to one decimal place.)
- 6. Determine the operating leverage.
1.
Prepare an estimated income statement for 20Y7.
Explanation of Solution
Cost-Volume-Profit Analysis: It is a method followed to analyze the relationship between the sales, costs, and the related profit or loss at various levels of units sold. In other words, it shows the effect of the changes in the cost and the sales volume on the operating income of the company.
Prepare an estimated income statement for 20Y7.
| Company B | |||
| Estimated Income Statement | |||
| For the year ended December 31, 20Y8 | |||
| Particulars | Amount ($) | Amount ($) | Amount ($) |
| Sales (1) | 2,880,000 | ||
| Less: Cost of Goods sold: | |||
| Direct Materials (2) | 600,000 | ||
| Direct Labor (3) | 360,000 | ||
| Factory Overhead (4) | 422,000 | ||
| Cost of Goods Sold | (1,382,000) | ||
| Gross Profit | 1,498,000 | ||
| Less: Expenses: | |||
| Selling expenses: | |||
| Sales salaries and commissions (5) | 388,000 | ||
| Advertising | 116,000 | ||
| Travel | 4,000 | ||
| Miscellaneous selling expense (6) | 14,300 | ||
| Total selling expenses | 522,300 | ||
| Administrative expenses: | |||
| Office and Officers’ salaries | 325,000 | ||
| Supplies (7) | 54,000 | ||
| Miscellaneous administrative expenses (8) | 20,700 | ||
| Total administrative expenses | 399,700 | ||
| Total expenses | (922,000) | ||
| Income from operations | 576,000 | ||
Table (1)
Working note (1):
Determine sales.
Number of units to be sold =12,000 units
Selling price per unit =$240 per unit
Working note (2):
Determine the cost of direct materials.
Number of units to be sold =12,000 units
Direct Materials cost per unit =$50 per unit
Working note (3):
Determine the cost of direct labor.
Number of units to be sold =12,000 units
Direct labor cost per unit =$30 per unit
Working note (4):
Determine the cost of factory overhead.
Factory overhead-Fixed =$350,000
Number of units to be sold =12,000 units
Factory overhead-Variable cost per unit =$6 per unit
Working note (5):
Determine the sales salaries and commissions.
Sales salaries and commissions-Fixed =$340,000
Number of units to be sold =12,000 units
Sales salaries and commissions-Variable cost per unit =$4 per unit
Working note (6):
Determine the miscellaneous selling expense.
Miscellaneous selling expense-Fixed =$2,300
Number of units to be sold =12,000 units
Miscellaneous selling expense-Variable cost per unit =$1 per unit
Working note (7):
Determine the supplies.
Supplies-Fixed =$6,000
Number of units to be sold =12,000 units
Supplies-Variable cost per unit =$4 per unit
Working note (8):
Determine the miscellaneous administrative expense.
Miscellaneous administrative expense-Fixed =$8,700
Number of units to be sold =12,000 units
Miscellaneous administrative expense-Variable cost per unit =$1 per unit
2.
Calculate the expected contribution margin ratio.
Explanation of Solution
Determine the expected contribution margin ratio.
Sales =$2,880,000 (1)
Variable cost =$1,152,000 (9)
Working note (9):
Determine the variable cost.
Number of units to be sold =12,000 units
Variable cost per unit =$96 per unit
Therefore, the expected contribution margin ratio is 60%.
3.
Calculate the break-even sales in units and dollars.
Explanation of Solution
Determine the break-even sales in units.
Fixed cost =$1,152,000
Contribution margin per unit =$144 per unit (10)
Working note (10):
Compute the contribution margin per unit.
Selling price per unit =$240 per unit
Variable cost per unit =$96 per unit
Determine the break-even sales in dollars.
Fixed cost =$1,152,000
Contribution margin ratio =60% (refer Part 2)
Therefore, the break-even sales in units is 8,000 units and dollars is $1,920,000.
4.
Construct a cost-volume-profit chart indicating the break-even sales.
Explanation of Solution
Construct a cost-volume-profit chart indicating the break-even sales.
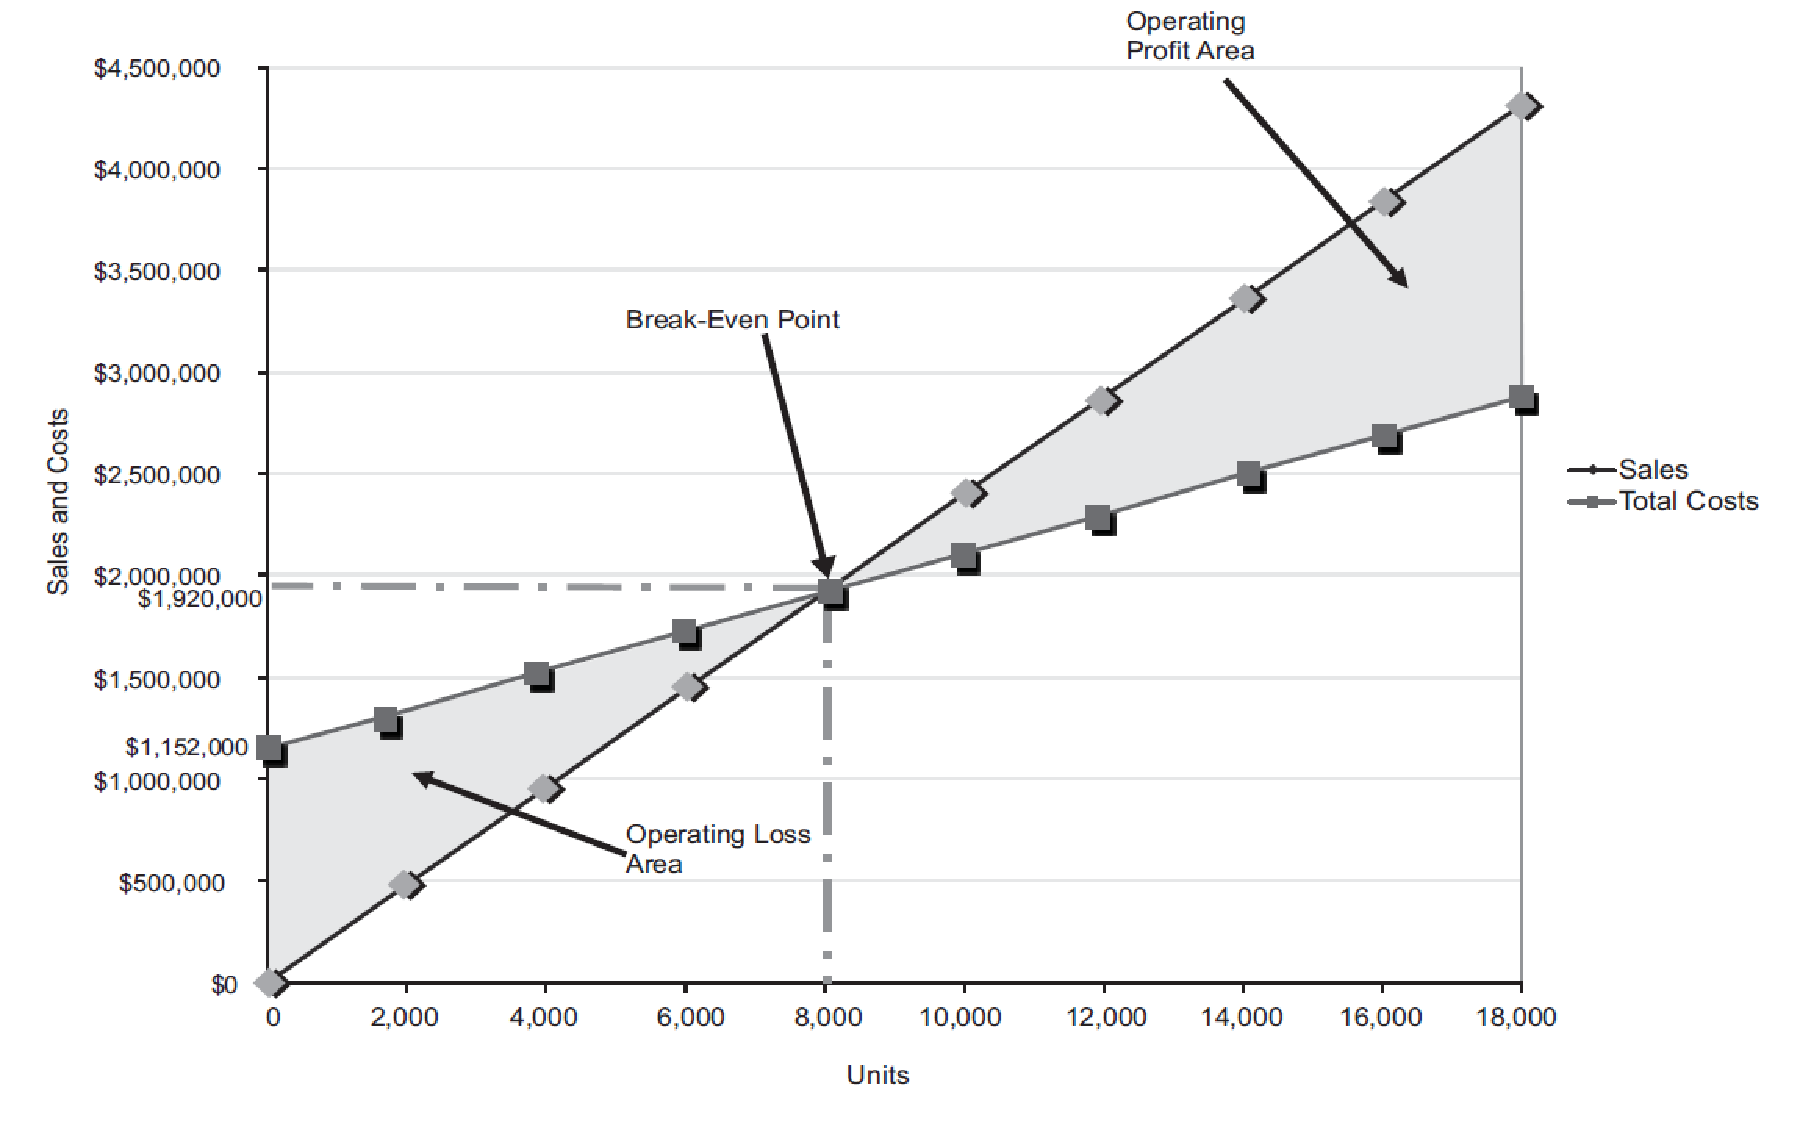
Figure (1)
The volume in units of sales is shown on the horizontal axis. The maximum relevant range is 18,000 units. The sales and the total costs (fixed cost and variable cost) in dollars is shown on the vertical axis. The maximum relevant range of sales and total costs is $4,500,000.
The total sales line is drawn right upward by connecting the first point at $0 to the second point at $4,320,000
The total cost line is drawn right upward by connecting the first point at $1,152,000 (fixed cost) on the vertical axis to the second point at
The break-even point is the intersection point where the total sales line and total cost line meet. The vertical dotted line drawn downward from the intersection point reaches at 8,000 units. It indicates the break-even sales (units). The horizontal line drawn to the left towards the vertical axis reaches at $1,920,000. It indicates the break-even sales (dollars). Refer Part 3 for the break-even values.
The operating profit area is the area where the total sales line exceeds the total cost line. However, the operating loss area is the area where the total cost exceeds the total sales line.
5.
Calculate the expected margin of safety in dollars and as a percentage of sales.
Explanation of Solution
Determine the expected margin of safety in dollars.
Sales =$2,880,000 (1)
Sales at break-even point =$1,920,000 (refer Part 3)
Determine the expected margin of safety as a percentage of sales.
Sales =$2,880,000 (1)
Margin of Safety in dollars =$960,000
Therefore, the expected margin of safety in dollars is $960,000 and as a percentage of sales is 33.3%.
6.
Calculate the operating leverage.
Explanation of Solution
Determine the operating leverage.
Contribution margin =$1,728,000 (11)
Income from operations =$576,000 (refer Table 1)
Working note (11):
Determine the contribution margin
Sales =$2,880,000 (1)
Variable cost =$1,152,000 (9)
Therefore, the operating leverage is 3.
Want to see more full solutions like this?
Chapter 5 Solutions
Managerial Accounting


- Dorian Systems earned revenues of $108,500 during 2020, had expenses of $81,200, purchased assets costing $13,400, and paid dividends of $9,100. What was Dorian Systems' net income for the year?arrow_forwardWhat effect will acceptance of the offer have on net income?arrow_forwardWhat is coastal venture net income or for the year?arrow_forward
- Calculate the cost of goods sold and the value of ending inventory using the FIFO method.arrow_forwardI am trying to find the accurate solution to this general accounting problem with the correct explanation.arrow_forwardCan you help me solve this general accounting problem with the correct methodology?arrow_forward
- Hewlett Processing combines seaweed extract and minerals. After joint manufacturing costs of $5,200 have been incurred, the mixture separates into two products, organic fertilizer and marine collagen. At the split-off point, organic fertilizer can be sold for $8,700, and the marine collagen can be sold for $12,300. The organic fertilizer can be further processed at a cost of $6,800 to make plant food capsules, which could be sold for $19,800. The marine collagen can be further processed at a cost of $9,400 to make beauty supplements, which could be sold for $18,900. What is the net increase (decrease) in operating income from plant food capsules?arrow_forwardSolve thisarrow_forwardCan you explain the process for solving this financial accounting question accurately?arrow_forward
- A business purchased machinery for $210,000 on January 1, 2023.arrow_forwardAn asset owned by Shahidi Technologies has a book value of $36,750 on June 30, Year 5. The asset has been depreciated at an annual rate of $8,200 using the straight-line method. Assuming the asset is sold on June 30, Year 5 for $41,500, how should the company record the transaction? a. Neither a gain nor a loss is recognized on this type of transaction. b. A gain on sale of $4,750. c. A gain on sale of $4,000. d. A loss on sale of $4,750. e. A loss on sale of $4,000.arrow_forwardTaylor Technologies purchased a server system for its data center at a cost of $124,800. The server system has an estimated residual value of $9,200 and an estimated useful life of 8 years. What is the amount of the annual depreciation computed by the straight-line method?arrow_forward
 Managerial AccountingAccountingISBN:9781337912020Author:Carl Warren, Ph.d. Cma William B. TaylerPublisher:South-Western College Pub
 Financial And Managerial AccountingAccountingISBN:9781337902663Author:WARREN, Carl S.Publisher:Cengage Learning,
 College Accounting, Chapters 1-27AccountingISBN:9781337794756Author:HEINTZ, James A.Publisher:Cengage Learning,
 Managerial Accounting: The Cornerstone of Busines...AccountingISBN:9781337115773Author:Maryanne M. Mowen, Don R. Hansen, Dan L. HeitgerPublisher:Cengage Learning
 Principles of Accounting Volume 2AccountingISBN:9781947172609Author:OpenStaxPublisher:OpenStax College