
Concept Introduction:
World
Domestic Demand Curve: The curve which shows how the quantity demanded by changes due to change in the price when there is no trade. It is negatively sloped curve.
Domestic Supply Curve: The curve which shows how the quantity supplied changes due to change in the price when there is no trade. It is positively sloped curve.
Tariff: It imposes restriction on the goods that are imported. It is an indirect tax levied on the goods in case of import and export.
Answer to Problem 6P
a. Effect of trade of tomatoes on U.S and Mexican consumer.
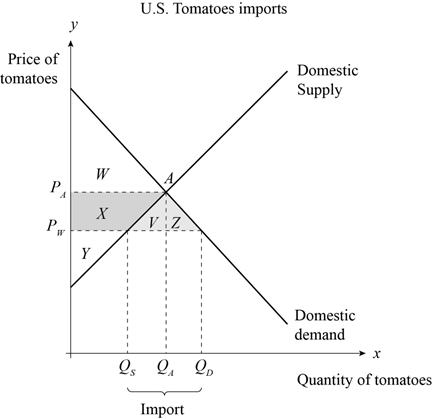
Fig 1
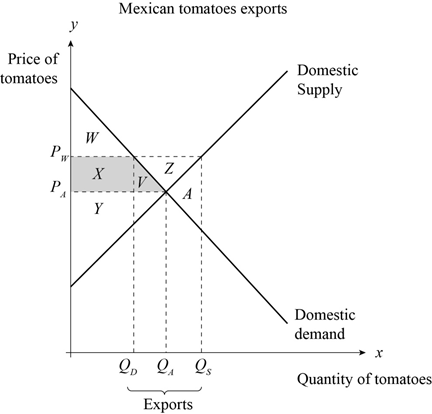
Fig 2
Explanation of Solution
U.S. Consumer
- In the figure 1 the equilibrium without trade is at point A where domestic price and quantity of tomato is PAand QArespectively. The world price is PW. The quantity demanded at world price is QDand the quantity supplied at the world price is QS.and U.S imports the deficit from Mexico.
- Due to import, the price has decreased in U.S and the consumer surplus has increased by the shaded area equal to

Mexican Consumer
- In the figure 2 the equilibrium without trade is at point A where domestic price and quantity of tomato is PAand QArespectively. The world price is PW. The quantity demanded at world price is QDand the quantity supplied at the world price is QS.and Mexico exports the surplus to U.S.
- Due to export the price has increased in Mexico and the consumer surplus has decreased by the shaded area equal to

b. Effect of trade of tomatoes on U.S and Mexican producer.
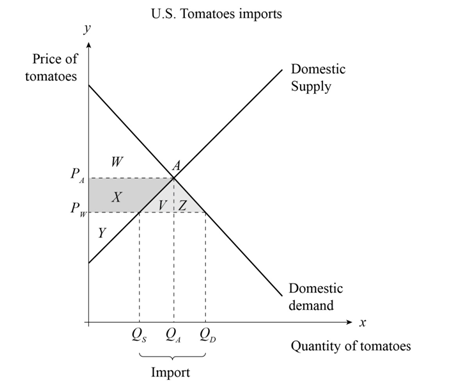
Fig 3
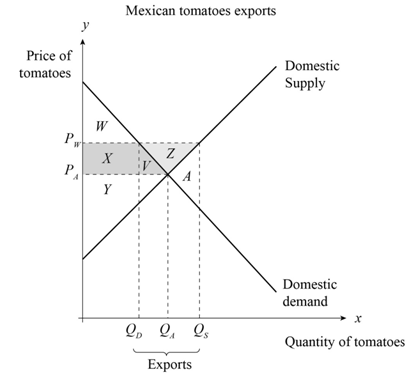
Fig 4
U.S. Producer
- In the figure 3 the equilibrium without trade is at point A where domestic price and quantity of tomato is PAand QArespectively. The world price is PW. The quantity demanded at world price is QDand the quantity supplied at the world price is QS.and U.S imports the deficit from Mexico.
- Due to import the price has decreased in U.S and the producer surplus has decreased by the shaded area equal to (X).
Mexican Producer
- In the figure 4, the equilibrium without trade is at point A where domestic price and quantity of tomato is PAand QArespectively. The world price is PW. The quantity demanded at world price is QDand the quantity supplied at the world price is QS.So, Mexico exports the surplus to U.S.
- Due to export the price has increased in Mexico and the producer surplus has decreased by the shaded area equal to

c. Effect of trade on Mexican and U.S tomato workers.
Tomato workers in U.S are negatively affected but the workers in Mexico will benefit.
- Due to international trade, U.S. imports tomatoes. As a result, the demand for domestic potatoes decreases and the wage of U.S. workers who are involved in the production of tomatoes decreases.
- Due to international trade Mexico exports tomatoes. As a result, the demand for domestic potatoes increases and the wage of Mexican workers who are involved in the production of tomatoes increases.
d. Effect of trade of poultry on U.S and Mexican consumer.
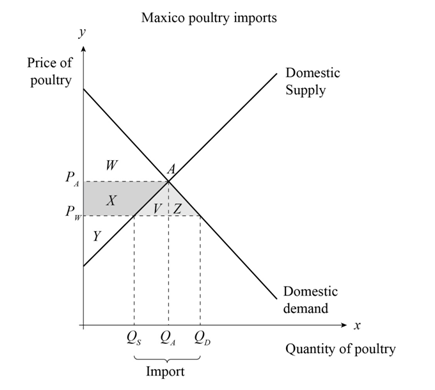
Fig 5
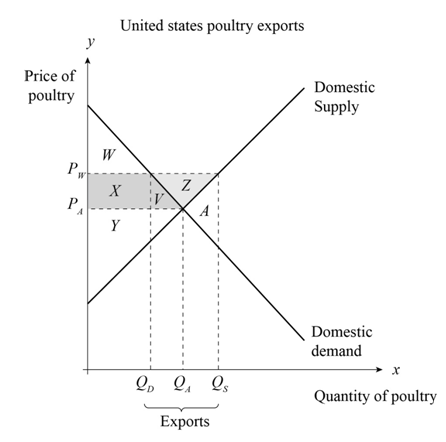
Fig 6
Mexican Consumer:
- In the figure 5, the equilibrium without trade is at point A where domestic price and quantity of poultry is PAand QArespectively. The world price is PW. The quantity demanded at world price is QDand the quantity supplied at the world price is QS.and Mexico imports the deficit from U.S.
- Due to import of poultry the price has decreased in Mexico and the consumer surplus has increased by the shaded area equal to

U.S. Consumer
- In the figure 6, the equilibrium without trade is at point A where domestic price and quantity of poultry is PAand QArespectively. The world price is PW. The quantity demanded at world price is QDand the quantity supplied at the world price is QS,and. U.S exports the surplus to Mexico.
- Due to export the price has increased in U.S. As a result, the consumer surplus has decreased by the shaded area equal to

e. Effect of trade of poultry on U.S and Mexican producer.
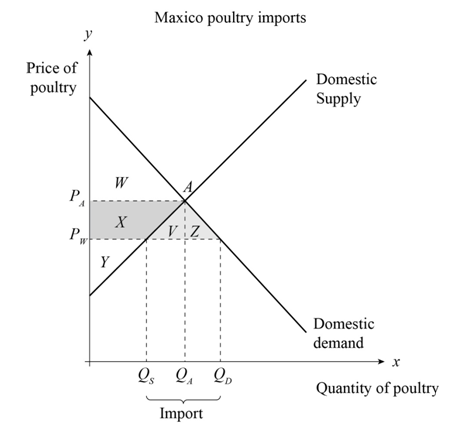
Fig 7
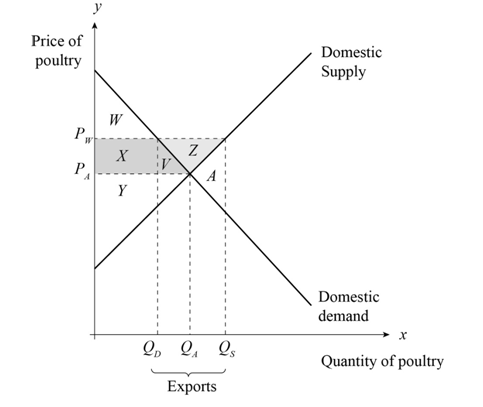
Fig 8
Mexican Producer
- In the figure 7 the equilibrium without trade is at point A where domestic price and quantity of poultry is PAand QArespectively. The world price is PW. The quantity demanded at world price is QDand the quantity supplied at the world price is QS.and Mexico imports the deficit from U.S.
- Due to import of poultry the price has decreased in Mexico and the producer surplus has decreased by the shaded area equal to

U.S. Producer
- In the figure 8, the equilibrium without trade is at point A where domestic price and quantity of poultry is PAand QArespectively. The world price is PW. The quantity demanded at world price is QDand the quantity supplied at the world price is QS.and U.S exports the surplus to Mexico.
- Due to export the price has increased in U.S and the producer surplus has increased by the shaded area equal to

f. Effect of trade on Mexican and U.S poultry workers.
Poultry workers in Mexico are negatively affected but workers in USA are will benefit.
- Due to international trade U.S. exports poultry to Mexico. As a result the demand for domestic poultry increases in the world market so, the wage of U.S. workers who are involved in the poultry farming increases.
- Due to international trade Mexico imports poultry from U.S. As a result the demand for domestic poultry decreases so, the wage of Mexican workers who are involved in the poultry farming decreases.
Want to see more full solutions like this?
Chapter 5 Solutions
LaunchPad for Krugman's Macroeconomics (Six Month Access)

- As indicated in the attached image, U.S. earnings for high- and low-skill workers as measured by educational attainment began diverging in the 1980s. The remaining questions in this problem set use the model for the labor market developed in class to walk through potential explanations for this trend. 1. Assume that there are just two types of workers, low- and high-skill. As a result, there are two labor markets: supply and demand for low-skill workers and supply and demand for high-skill workers. Using two carefully drawn labor-market figures, show that an increase in the demand for high skill workers can explain an increase in the relative wage of high-skill workers. 2. Using the same assumptions as in the previous question, use two carefully drawn labor-market figures to show that an increase in the supply of low-skill workers can explain an increase in the relative wage of high-skill workers.arrow_forwardPublished in 1980, the book Free to Choose discusses how economists Milton Friedman and Rose Friedman proposed a one-sided view of the benefits of a voucher system. However, there are other economists who disagree about the potential effects of a voucher system.arrow_forwardThe following diagram illustrates the demand and marginal revenue curves facing a monopoly in an industry with no economies or diseconomies of scale. In the short and long run, MC = ATC. a. Calculate the values of profit, consumer surplus, and deadweight loss, and illustrate these on the graph. b. Repeat the calculations in part a, but now assume the monopoly is able to practice perfect price discrimination.arrow_forward
- how commond economies relate to principle Of Economics ?arrow_forwardCritically analyse the five (5) characteristics of Ubuntu and provide examples of how they apply to the National Health Insurance (NHI) in South Africa.arrow_forwardCritically analyse the five (5) characteristics of Ubuntu and provide examples of how they apply to the National Health Insurance (NHI) in South Africa.arrow_forward

 Principles of Economics (12th Edition)EconomicsISBN:9780134078779Author:Karl E. Case, Ray C. Fair, Sharon E. OsterPublisher:PEARSON
 Engineering Economy (17th Edition)EconomicsISBN:9780134870069Author:William G. Sullivan, Elin M. Wicks, C. Patrick KoellingPublisher:PEARSON
 Principles of Economics (MindTap Course List)EconomicsISBN:9781305585126Author:N. Gregory MankiwPublisher:Cengage Learning
 Managerial Economics: A Problem Solving ApproachEconomicsISBN:9781337106665Author:Luke M. Froeb, Brian T. McCann, Michael R. Ward, Mike ShorPublisher:Cengage Learning
 Managerial Economics & Business Strategy (Mcgraw-...EconomicsISBN:9781259290619Author:Michael Baye, Jeff PrincePublisher:McGraw-Hill Education