
Concept Introduction:
World
Domestic Demand Curve: The curve which shows how the quantity demanded by changes due to change in the price when there is no trade. It is negatively sloped curve.
Domestic Supply Curve: The curve which shows how the quantity supplied changes due to change in the price when there is no trade. It is positively sloped curve.
Tariff: It imposes restriction on the goods that are imported. It is an indirect tax levied on the goods in case of import and export.
Answer to Problem 6P
a. Effect of trade of tomatoes on U.S and Mexican consumer.
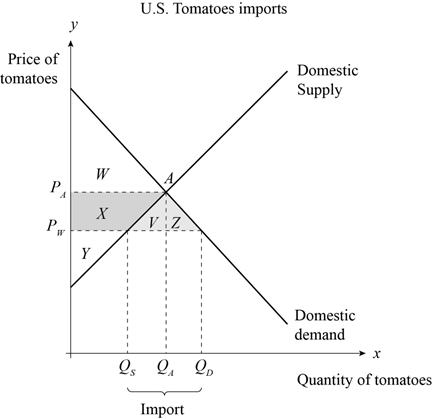
Fig 1
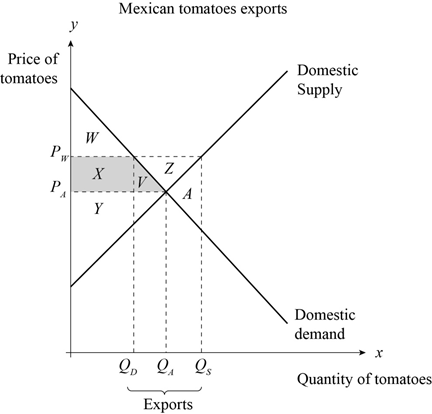
Fig 2
Explanation of Solution
U.S. Consumer
- In the figure 1 the equilibrium without trade is at point A where domestic price and quantity of tomato is PAand QArespectively. The world price is PW. The quantity demanded at world price is QDand the quantity supplied at the world price is QS.and U.S imports the deficit from Mexico.
- Due to import, the price has decreased in U.S and the consumer surplus has increased by the shaded area equal to

Mexican Consumer
- In the figure 2 the equilibrium without trade is at point A where domestic price and quantity of tomato is PAand QArespectively. The world price is PW. The quantity demanded at world price is QDand the quantity supplied at the world price is QS.and Mexico exports the surplus to U.S.
- Due to export the price has increased in Mexico and the consumer surplus has decreased by the shaded area equal to

b. Effect of trade of tomatoes on U.S and Mexican producer.
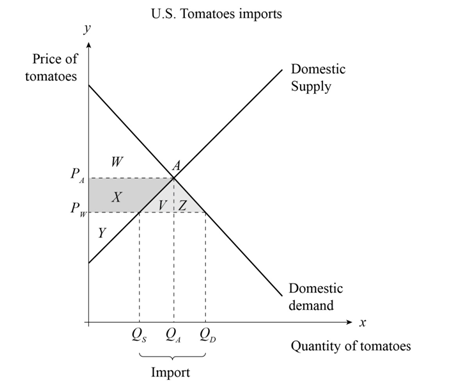
Fig 3
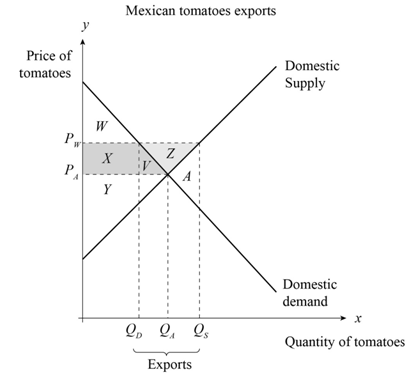
Fig 4
U.S. Producer
- In the figure 3 the equilibrium without trade is at point A where domestic price and quantity of tomato is PAand QArespectively. The world price is PW. The quantity demanded at world price is QDand the quantity supplied at the world price is QS.and U.S imports the deficit from Mexico.
- Due to import the price has decreased in U.S and the producer surplus has decreased by the shaded area equal to (X).
Mexican Producer
- In the figure 4, the equilibrium without trade is at point A where domestic price and quantity of tomato is PAand QArespectively. The world price is PW. The quantity demanded at world price is QDand the quantity supplied at the world price is QS.So, Mexico exports the surplus to U.S.
- Due to export the price has increased in Mexico and the producer surplus has decreased by the shaded area equal to

c. Effect of trade on Mexican and U.S tomato workers.
Tomato workers in U.S are negatively affected but the workers in Mexico will benefit.
- Due to international trade, U.S. imports tomatoes. As a result, the demand for domestic potatoes decreases and the wage of U.S. workers who are involved in the production of tomatoes decreases.
- Due to international trade Mexico exports tomatoes. As a result, the demand for domestic potatoes increases and the wage of Mexican workers who are involved in the production of tomatoes increases.
d. Effect of trade of poultry on U.S and Mexican consumer.
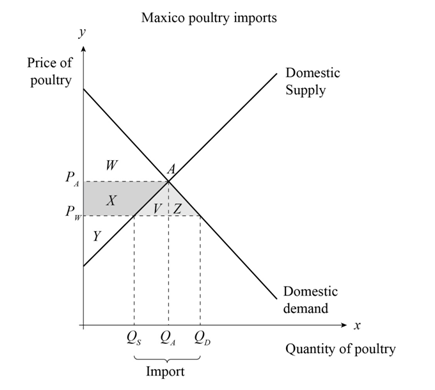
Fig 5
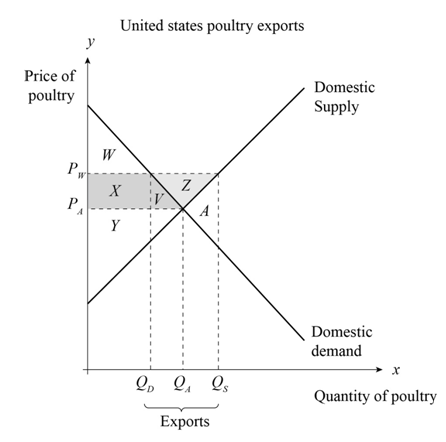
Fig 6
Mexican Consumer:
- In the figure 5, the equilibrium without trade is at point A where domestic price and quantity of poultry is PAand QArespectively. The world price is PW. The quantity demanded at world price is QDand the quantity supplied at the world price is QS.and Mexico imports the deficit from U.S.
- Due to import of poultry the price has decreased in Mexico and the consumer surplus has increased by the shaded area equal to

U.S. Consumer
- In the figure 6, the equilibrium without trade is at point A where domestic price and quantity of poultry is PAand QArespectively. The world price is PW. The quantity demanded at world price is QDand the quantity supplied at the world price is QS,and. U.S exports the surplus to Mexico.
- Due to export the price has increased in U.S. As a result, the consumer surplus has decreased by the shaded area equal to

e. Effect of trade of poultry on U.S and Mexican producer.
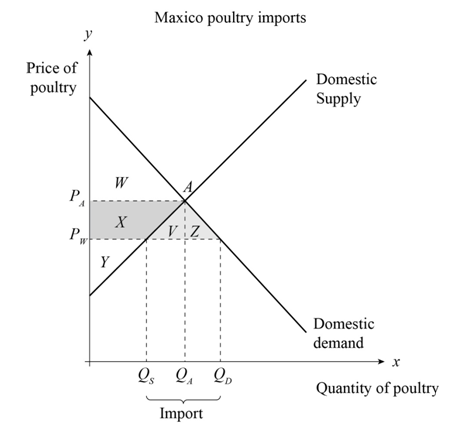
Fig 7
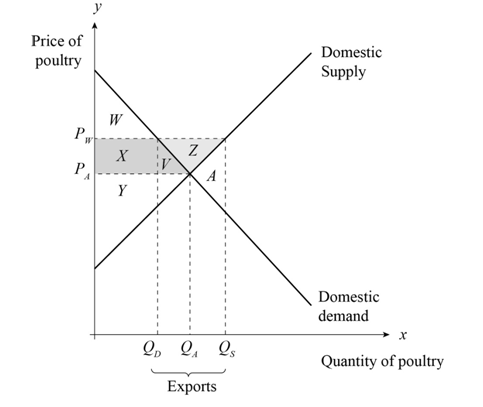
Fig 8
Mexican Producer
- In the figure 7 the equilibrium without trade is at point A where domestic price and quantity of poultry is PAand QArespectively. The world price is PW. The quantity demanded at world price is QDand the quantity supplied at the world price is QS.and Mexico imports the deficit from U.S.
- Due to import of poultry the price has decreased in Mexico and the producer surplus has decreased by the shaded area equal to

U.S. Producer
- In the figure 8, the equilibrium without trade is at point A where domestic price and quantity of poultry is PAand QArespectively. The world price is PW. The quantity demanded at world price is QDand the quantity supplied at the world price is QS.and U.S exports the surplus to Mexico.
- Due to export the price has increased in U.S and the producer surplus has increased by the shaded area equal to

f. Effect of trade on Mexican and U.S poultry workers.
Poultry workers in Mexico are negatively affected but workers in USA are will benefit.
- Due to international trade U.S. exports poultry to Mexico. As a result the demand for domestic poultry increases in the world market so, the wage of U.S. workers who are involved in the poultry farming increases.
- Due to international trade Mexico imports poultry from U.S. As a result the demand for domestic poultry decreases so, the wage of Mexican workers who are involved in the poultry farming decreases.
Want to see more full solutions like this?

- You are the manager of a large automobile dealership who wants to learn more about the effective- ness of various discounts offered to customers over the past 14 months. Following are the average negotiated prices for each month and the quantities sold of a basic model (adjusted for various options) over this period of time. 1. Graph this information on a scatter plot. Estimate the demand equation. What do the regression results indicate about the desirability of discounting the price? Explain. Month Price Quantity Jan. 12,500 15 Feb. 12,200 17 Mar. 11,900 16 Apr. 12,000 18 May 11,800 20 June 12,500 18 July 11,700 22 Aug. 12,100 15 Sept. 11,400 22 Oct. 11,400 25 Nov. 11,200 24 Dec. 11,000 30 Jan. 10,800 25 Feb. 10,000 28 2. What other factors besides price might be included in this equation? Do you foresee any difficulty in obtaining these additional data or incorporating them in the regression analysis?arrow_forwardsimple steps on how it should look like on excelarrow_forwardConsider options on a stock that does not pay dividends.The stock price is $100 per share, and the risk-free interest rate is 10%.Thestock moves randomly with u=1.25and d=1/u Use Excel to calculate the premium of a10-year call with a strike of $100.arrow_forward
- Please solve this, no words or explanations.arrow_forward17. Given that C=$700+0.8Y, I=$300, G=$600, what is Y if Y=C+I+G?arrow_forwardUse the Feynman technique throughout. Assume that you’re explaining the answer to someone who doesn’t know the topic at all. Write explanation in paragraphs and if you use currency use USD currency: 10. What is the mechanism or process that allows the expenditure multiplier to “work” in theKeynesian Cross Model? Explain and show both mathematically and graphically. What isthe underpinning assumption for the process to transpire?arrow_forward
- Use the Feynman technique throughout. Assume that you’reexplaining the answer to someone who doesn’t know the topic at all. Write it all in paragraphs: 2. Give an overview of the equation of exchange (EoE) as used by Classical Theory. Now,carefully explain each variable in the EoE. What is meant by the “quantity theory of money”and how is it different from or the same as the equation of exchange?arrow_forwardZbsbwhjw8272:shbwhahwh Zbsbwhjw8272:shbwhahwh Zbsbwhjw8272:shbwhahwhZbsbwhjw8272:shbwhahwhZbsbwhjw8272:shbwhahwharrow_forwardUse the Feynman technique throughout. Assume that you’re explaining the answer to someone who doesn’t know the topic at all:arrow_forward

 Principles of Economics (12th Edition)EconomicsISBN:9780134078779Author:Karl E. Case, Ray C. Fair, Sharon E. OsterPublisher:PEARSON
 Engineering Economy (17th Edition)EconomicsISBN:9780134870069Author:William G. Sullivan, Elin M. Wicks, C. Patrick KoellingPublisher:PEARSON
 Principles of Economics (MindTap Course List)EconomicsISBN:9781305585126Author:N. Gregory MankiwPublisher:Cengage Learning
 Managerial Economics: A Problem Solving ApproachEconomicsISBN:9781337106665Author:Luke M. Froeb, Brian T. McCann, Michael R. Ward, Mike ShorPublisher:Cengage Learning
 Managerial Economics & Business Strategy (Mcgraw-...EconomicsISBN:9781259290619Author:Michael Baye, Jeff PrincePublisher:McGraw-Hill Education