Videos
a.
Use the high-low method to estimate the fixed and variable portions of store costs based on employees.
a.
Explanation of Solution
High-low cost method:
High-low cost method helps in separating the fixed and variable cost from the total cost. It is calculated by comparing the highest and lowest level of activities and the cost of these activities.
Show the cost equation of fixed and variable cost with the
Thus, the cost equation is:
Working note 1:
Calculate the fixed cost:
Calculate the highest and lowest activity:
| Particular | Employees | Cost |
| Highest activity | 54 | $5,029 |
| Lowest activity | 26 | $2,374 |
Table: (1)
Working note 2:
Calculate the variable cost (unit) with the help of high-low cost method:
Working note 3:
Calculate the variable cost ($) with the help of high-low cost method:
b.
Use the results of your high-low analysis to estimate the cost for a store with 30 employees.
b.
Explanation of Solution
Total cost of store:
Total cost of the store includes the fixed and variable cost of the production. It is calculated by the cost equation.
Estimate the cost for the store:
Thus, the estimated cost for the store is $2,753.
c.
Prepare a scatter graph between store cost and employees.
c.
Explanation of Solution
Scatter graph:
Scatter graph shows the relationship between the cost and the activity. It shows the cost at various level of activity. It helps in finding the outlier in the data. So the management can eliminate it to make more effective decisions.
Prepare the scatter graph for store cost and employee:
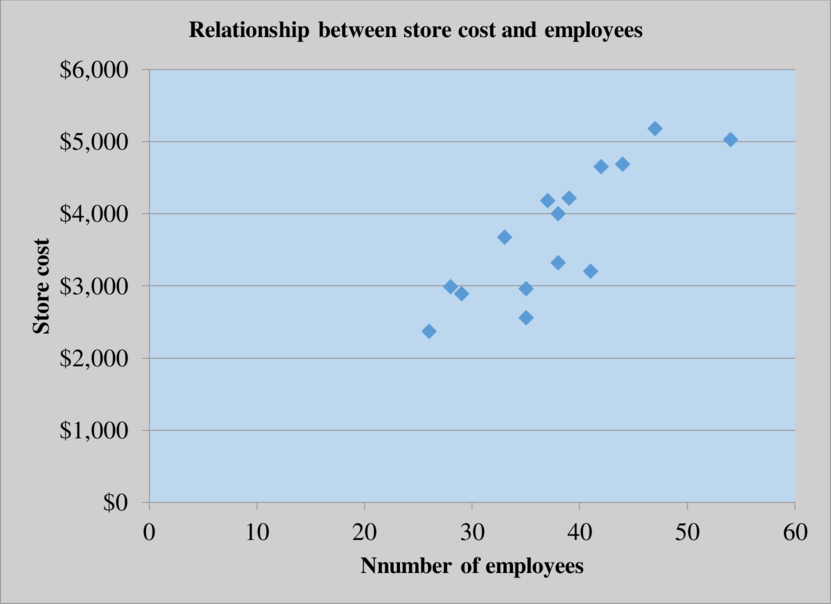
The scatter plot represents number of employees on the horizontal axis and the store cost on the vertical axis. The points on the scatter plot do not seem to form the linear pattern and there is not a healthy relationship as well.
d.
Prepare an estimate of the cost of a store with 30 employees using the results from a simple regression of store cost on employees.
d.
Answer to Problem 68P
The store cost is $2,930.
Explanation of Solution
Cost equation:
Cost equation is a mathematical representation of the cost estimation at various level of activity. It is used by defining the fixed cost and variable cost per unit and then the variable cost per unit is multiplied by the given variable to calculate the relative cost.
Thus, the store cost is $2,930.
e.
Prepare an estimate of the cost of a store with revenues of $2.5 million and 30 employees using the results of a multiple regression of store costs on store revenues and employees.
e.
Explanation of Solution
Multiple regressions:
Multiple regressions use two or more activities (variables) to establish the relationship between cost and activities:
Thus, the store cost is $2,935.8.
f.
Comment on the results of the regression analyses in parts d and e.
f.
Explanation of Solution
Regression analysis:
Regression analysis is used to show the relationship between the cost and the activity. It is used to estimate the cost at various level of activity.
The most important step in the calculation of regression analysis is to establish a logical relationship between the cost and the activity. The activity (independent variable) is placed on the right-hand-side and the cost (dependant variable) is placed on the left-hand-side of the graph.
Comment on the results of the regression analyses:
In case of simple and multiple regressions, the both of the coefficients are not very significant. But the both the R2 are similar and significant. This kind of problem arises when two or more independent variables in a multiple regression analyses are related to each other.
In the given case, the number of employees and revenue are closely related.
Want to see more full solutions like this?
Chapter 5 Solutions
Loose-leaf For Fundamentals Of Cost Accounting


- Base on the scenerio below Mr. Snow was extremely upset with the budget deficit. He immediately called you, the treasurer, to complain about the budget variance for the meal cost. He told you that the added dessert caused the meal cost to be $4,810 ($25,110-$20,300) over budget. He added, “I could expect a couple hundred dollars one way or the other, but several thousand is totally unacceptable. At the next budget meeting of the budget committee, I want you to explain what happened.” I need help Summarizing the results of the sales volume and variable cost volume variances computations based on the comparison between the master budget and the flexible budge. Along with Summarizing the results of the flexible budget variances computations based on the comparison between the flexible budget and the actual results.Justifing the favorable or unfavorable budget variances. Since this is a not-for-profit organization, addressing why anyone should be concerned with meeting the budget. Making…arrow_forwardSales commissions are $6,000 when 1,500 units are sold and $12,000 when 3,000 units are sold. Using the high-low method, what is the variable portion of sales salaries and commissions? Answerarrow_forwardCompute the net incomearrow_forward
- Larson Manufacturing Company observed that, during its busiest month of 2023, maintenance costs totaled $22,400, resulting from the production of 50,000 units. During its slowest month, $16,900 in maintenance costs were incurred, resulting from the production of 35,000 units. Use the high-low method to estimate the maintenance cost that the company will incur if it produces 42,000 units. (Calculation in 2 decimal)arrow_forwardSales commissions are $6,000 when 1,500 units are sold and $12,000 when 3,000 units are sold. Using the high-low method, what is the variable portion of sales salaries and commissions?arrow_forwardCan you solve this general accounting question with the appropriate accounting analysis techniques?arrow_forward

 AccountingAccountingISBN:9781337272094Author:WARREN, Carl S., Reeve, James M., Duchac, Jonathan E.Publisher:Cengage Learning,
 Accounting Information SystemsAccountingISBN:9781337619202Author:Hall, James A.Publisher:Cengage Learning,
 Horngren's Cost Accounting: A Managerial Emphasis...AccountingISBN:9780134475585Author:Srikant M. Datar, Madhav V. RajanPublisher:PEARSON
 Intermediate AccountingAccountingISBN:9781259722660Author:J. David Spiceland, Mark W. Nelson, Wayne M ThomasPublisher:McGraw-Hill Education
 Financial and Managerial AccountingAccountingISBN:9781259726705Author:John J Wild, Ken W. Shaw, Barbara Chiappetta Fundamental Accounting PrinciplesPublisher:McGraw-Hill Education