
Concept explainers
Videos
Interpretation:
Two stereoisomers of
Concept introduction:
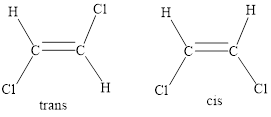
Cis-trans isomerism: In a compound with a Carbon-Carbon double bond, geometric isomerism is possible. The plane which is perpendicular to the pi-orbitals is considered the reference. There are a total of four substituents, two each at either of the carbons indulged in the double bond.
When two of the heaviest substituents are oriented on the same side of the reference plane, the geometric isomer is termed a ‘cis’-isomer.
When two of the heaviest substituents are oriented on the opposite sides of the reference plane, the geometric isomer is termed a ‘trans’-isomer.
Geometric isomers: Two atoms with the same side location of the double bond are called cis isomers and two atoms with opposite side locations of the double bond are called Trans isomers.
In a cyclic compound: The spatial orientation of the di substituents cyclic compound must be viewed as a three-dimensional conformation. Generally, a solid wedge bond indicates it is above the plane of the ring and a broken wedge bond indicates it is below the plane.
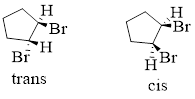
The stereoisomerism is the arrangement of atoms in molecules whose connectivity remains the same but their arrangement in different in each isomer.
The two molecules are described as stereoisomers if they are made of the same atoms connected in the same sequence, but the atoms are positions differently in space.
For
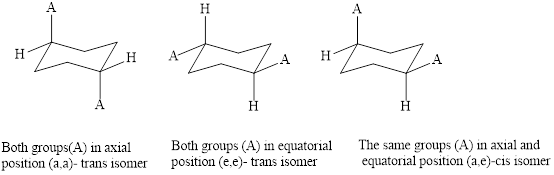
Among this the equatorial isomer is more stable due to the absence of
Chiral centre: A chiral center is defined as the tetrahedral carbon atom in an organic molecule that is connected to four non-identical groups/substituents. It is sometimes known as a stereo genic center.
Want to see the full answer?
Check out a sample textbook solution
Chapter 5 Solutions
KLEIN'S ORGANIC CHEMISTRY


- helparrow_forwardThe temperature on a sample of pure X held at 1.25 atm and -54. °C is increased until the sample boils. The temperature is then held constant and the pressure is decreased by 0.42 atm. On the phase diagram below draw a path that shows this set of changes. pressure (atm) 2 0 0 200 400 temperature (K) Xarrow_forwardQUESTION: Answer Question 5: 'Calculating standard error of regression' STEP 1 by filling in all the empty green boxes *The values are all provided in the photo attached*arrow_forward
- pressure (atm) 3 The pressure on a sample of pure X held at 47. °C and 0.88 atm is increased until the sample condenses. The pressure is then held constant and the temperature is decreased by 82. °C. On the phase diagram below draw a path that shows this set of changes. 0 0 200 temperature (K) 400 аarrow_forwarder your payment details | bar xb Home | bartleby x + aleksogi/x/isl.exe/1o u-lgNskr7j8P3jH-1Qs_pBanHhviTCeeBZbufuBYT0Hz7m7D3ZcW81NC1d8Kzb4srFik1OUFhKMUXzhGpw7k1 O States of Matter Sketching a described thermodynamic change on a phase diagram 0/5 The pressure on a sample of pure X held at 47. °C and 0.88 atm is increased until the sample condenses. The pressure is then held constant and the temperature is decreased by 82. °C. On the phase diagram below draw a path that shows this set of changes. pressure (atm) 1 3- 0- 0 200 Explanation Check temperature (K) 400 X Q Search L G 2025 McGraw Hill LLC. All Rights Reserved Terms of Use Privacy Cearrow_forward5.arrow_forward
- 6.arrow_forward0/5 alekscgi/x/sl.exe/1o_u-IgNglkr7j8P3jH-IQs_pBaHhvlTCeeBZbufuBYTi0Hz7m7D3ZcSLEFovsXaorzoFtUs | AbtAURtkqzol 1HRAS286, O States of Matter Sketching a described thermodynamic change on a phase diagram The pressure on a sample of pure X held at 47. °C and 0.88 atm is increased until the sample condenses. The pressure is then held constant and the temperature is decreased by 82. °C. On the phase diagram below draw a path that shows this set of changes. 3 pressure (atm) + 0- 0 5+ 200 temperature (K) 400 Explanation Check X 0+ F3 F4 F5 F6 F7 S 2025 McGraw Hill LLC All Rights Reserved. Terms of Use Privacy Center Accessibility Q Search LUCR + F8 F9 F10 F11 F12 * % & ( 5 6 7 8 9 Y'S Dele Insert PrtSc + Backsarrow_forward5.arrow_forward
- 9arrow_forwardalekscgi/x/lsl.exe/1o_u-IgNslkr7j8P3jH-IQs_pBanHhvlTCeeBZbufu BYTI0Hz7m7D3ZS18w-nDB10538ZsAtmorZoFusYj2Xu9b78gZo- O States of Matter Sketching a described thermodynamic change on a phase diagram 0/5 The pressure on a sample of pure X held at 47. °C and 0.88 atm is increased until the sample condenses. The pressure is then held constant and the temperature is decreased by 82. °C. On the phase diagram below draw a path that shows this set of changes. pressure (atm) 3- 200 temperature (K) Explanation Chick Q Sowncharrow_forward0+ aleksog/x/lsl.exe/1ou-lgNgkr7j8P3H-IQs pBaHhviTCeeBZbufuBYTOHz7m7D3ZStEPTBSB3u9bsp3Da pl19qomOXLhvWbH9wmXW5zm O States of Matter Sketching a described thermodynamic change on a phase diagram 0/5 Gab The temperature on a sample of pure X held at 0.75 atm and -229. °C is increased until the sample sublimes. The temperature is then held constant and the pressure is decreased by 0.50 atm. On the phase diagram below draw a path that shows this set of changes. F3 pressure (atm) 0- 0 200 Explanation temperature (K) Check F4 F5 ☀+ Q Search Chill Will an 9 ENG F6 F7 F8 F9 8 Delete F10 F11 F12 Insert PrtSc 114 d Ararrow_forward
 ChemistryChemistryISBN:9781305957404Author:Steven S. Zumdahl, Susan A. Zumdahl, Donald J. DeCostePublisher:Cengage Learning
 ChemistryChemistryISBN:9781259911156Author:Raymond Chang Dr., Jason Overby ProfessorPublisher:McGraw-Hill Education
 Principles of Instrumental AnalysisChemistryISBN:9781305577213Author:Douglas A. Skoog, F. James Holler, Stanley R. CrouchPublisher:Cengage Learning
 Organic ChemistryChemistryISBN:9780078021558Author:Janice Gorzynski Smith Dr.Publisher:McGraw-Hill Education
 Chemistry: Principles and ReactionsChemistryISBN:9781305079373Author:William L. Masterton, Cecile N. HurleyPublisher:Cengage Learning
 Elementary Principles of Chemical Processes, Bind...ChemistryISBN:9781118431221Author:Richard M. Felder, Ronald W. Rousseau, Lisa G. BullardPublisher:WILEY