
Concept explainers
Videos
(a)
Introduction: Profit & loss statement is a statement which presents the revenues and expenses of the company in a structured way to reflect the net income/loss earned the company. Primarily, there are two methods of presenting the profit & loss statement i.e. condensed and detailed.
To construct: The base case projected P&L statement for radiologist group.
(a)
Answer to Problem 5.3P
Radiologist group’s net income is $62,500.
Explanation of Solution
Projected P&L statement for group is as follows:
| Particulars | Per procedure | Amount |
| Charge (revenue) for 7,500 patients | $ 100 | $ 750,000 |
| Less: Variable cost | $ 25 | $ 187,500 |
| Contribution | $ 75 | $ 562,500 |
| Less: Fixed cost | $ 500,000 | |
| Net income | $ 62,500 |
(b)
Introduction: Contribution margin can be computed by deducting variable cost from the sales value. Break-even point refers to a point where total expenses and total revenue of a company are equal. Break-even point can be described as a situation where there is no net profit or loss.
To find: Group’s contribution margin and breakeven point.
(b)
Answer to Problem 5.3P
Group’s contribution margin is $562,500 and breakeven point is$666,667.
Explanation of Solution
(c)
Sales volume at which group can earn a pre-tax profit of $100,000 and $200,000.
(c)
Answer to Problem 5.3P
- Sales volume to earn a profit level of $100,000 is $800,000.
- Sales volume to earn a profit level of $200,000 is $933,333.
Explanation of Solution
Desired sales volume to earn a profit level of $100,000
Desired sales volume to earn a profit level of $200,000
(d)
Sketch out CVP analysis graph depicting base situation.
(d)
Answer to Problem 5.3P
Breakeven point in CVP analysis graph is $666,667.
Explanation of Solution
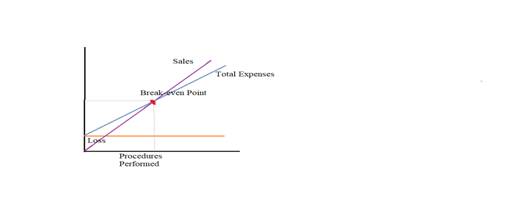
The graph above depicts the CVP analysis. The horizontal line depicts the fixed costs in the above diagram which is to be incurred irrespective of sales volumes. The intersection point of sales and total expenses on CVP graph is referred to as “Break-even point”.
(e)
Recalculate sub-parts (a) to (d) when 20% discount is given from charges (revenue).
(e)
Answer to Problem 5.3P
- Radiologist group’s net loss is $87,500.
- Group’s contribution margin is $412,500 and breakeven point is $727,273.
- Sales volume to earn a profit level of $100,000 is $872,727.
- Sales volume to earn a profit level of $200,000 is $1,018,182.
Explanation of Solution
(a) Radiologist group’s net income
| Particulars | Per procedure | Amount |
| Charge (revenue) for 7,500 patients | $ 80 | $ 600,000 |
| Less: Variable cost | $ 25 | $ 187,500 |
| Contribution | $ 55 | $ 412,500 |
| Less: Fixed cost | $ 500,000 | |
| Net loss | $ (87,500) |
(b) Group’s contribution margin and breakeven point
(c) Sales volume to earn a profit level of $100,000 and $200,000
(d) CVP analysis graph

The graph above depicts the CVP analysis. The horizontal line depicts the fixed costs in the above diagram which is to be incurred irrespective of sales volumes. The intersection point of sales and total expenses on CVP graph is referred to as “Break-even point”. Break-even point in the graph above is $727,273.
Want to see more full solutions like this?
Chapter 5 Solutions
Healthcare Finance: An Introduction to Accounting and Financial Management


 Cornerstones of Cost Management (Cornerstones Ser...AccountingISBN:9781305970663Author:Don R. Hansen, Maryanne M. MowenPublisher:Cengage Learning