
Concept explainers
The classification of soil based on United States department of agriculture textural classification chart.
Answer to Problem 5.1P
The classification of soil A as per the United States department of agriculture textural classification chart is
The classification of soil B as per the United States department of agriculture textural classification chart is
The classification of soil C as per the United States department of agriculture textural classification chart is
The classification of soil D as per the United States department of agriculture textural classification chart is
The classification of soil E as per the United States department of agriculture textural classification chart is
The classification of soil F as per the United States department of agriculture textural classification chart is
The classification of soil G as per the United States department of agriculture textural classification chart is
The classification of soil H as per the United States department of agriculture textural classification chart is
The classification of soil I as per the United States department of agriculture textural classification chart is
The classification of soil J as per the United States department of agriculture textural classification chart is
Explanation of Solution
Calculation:
Consider soil A:
Refer Figure (5.1) “U.S. Department of agriculture textural classification (USDA)”
in the text book.
Mark the percentage of sand for soil A as 20 %, percentage of silt as 20 %, and percentage of clay as 60 % in Figure (5.1) and mark the point of intersection of three lines.
Show the percentage of sand, silt, and clay of soil A as in Figure (1).
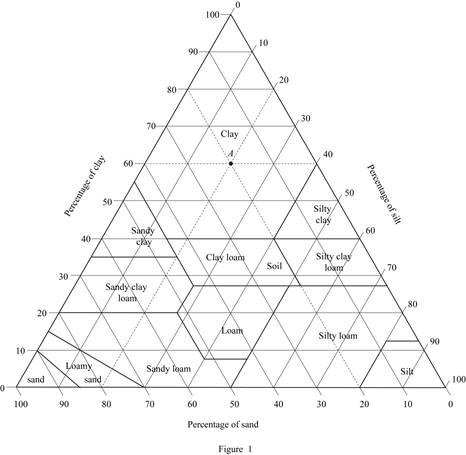
Refer Figure (1).
Hence, the classification of soil A as per the United States department of agriculture textural classification chart is
Consider soil B:
Mark the percentage of sand for soil B as 55 %, percentage of silt as 5 %, and percentage of clay as 40 % in Figure (5.1) and mark the point of intersection of three lines.
Show the percentage of sand, silt, and clay of soil B as in Figure (2).
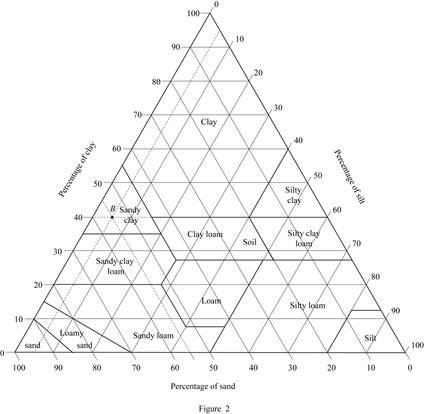
Refer Figure (2).
Thus, classification of soil B as per the United States department of agriculture textural classification chart is
Consider soil C:
Mark the percentage of sand for soil C as 45 %, percentage of silt as 35 %, and percentage of clay as 20 % in Figure (5.1) and mark the point of intersection of three lines.
Show the percentage of sand, silt, and clay of soil C as in Figure (3).
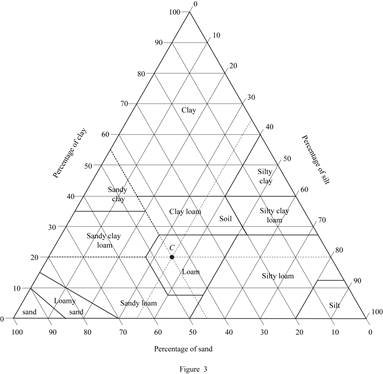
Refer Figure (3).
The classification of soil C as per the United States department of agriculture textural classification chart is
Consider soil D:
Mark the percentage of sand for soil D as 50 %, percentage of silt as 15 %, and percentage of clay as 35 % in Figure (5.1) and mark the point of intersection of three lines.
Show the percentage of sand, silt, and clay of soil D as in Figure (4).
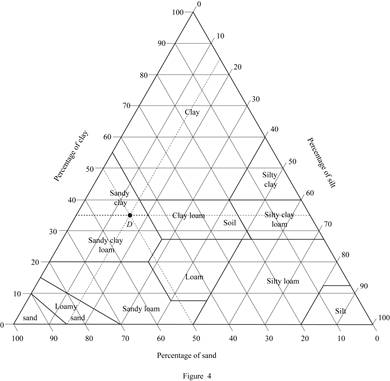
Refer Figure (4).
The classification of soil D as per the United States department of agriculture textural classification chart is
Consider soil E:
Mark the percentage of sand for soil E as 70 %, percentage of silt as 15 %, and percentage of clay as 15 % in Figure (5.1) and mark the point of intersection of three lines.
Show the percentage of sand, silt, and clay of soil E as in Figure (5).
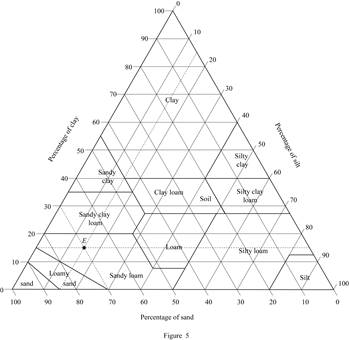
Refer Figure (5).
The classification of soil E as per the United States department of agriculture textural classification chart is
Consider soil F:
Refer Figure (5.1) “U.S. Department of agriculture textural classification (USDA)”
in the text book.
Mark the percentage of sand for soil F as 30 %, percentage of silt as 58 %, and percentage of clay as 12 % in Figure (5.1) and mark the point of intersection of three lines.
Show the percentage of sand, silt, and clay of soil F as in Figure (6).
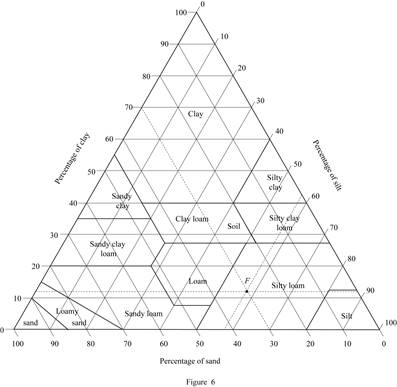
Refer Figure (6).
Hence, the classification of soil F as per the United States department of agriculture textural classification chart is
Consider soil G:
Mark the percentage of sand for soil G as 40 %, percentage of silt as 25 %, and percentage of clay as 35 % in Figure (5.1) and mark the point of intersection of three lines.
Show the percentage of sand, silt, and clay of soil G as in Figure (7).
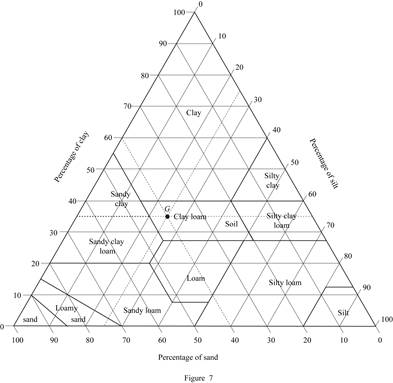
Refer Figure (7).
Thus, classification of soil G as per the United States department of agriculture textural classification chart is
Consider soil H:
Mark the percentage of sand for soil H as 30 %, percentage of silt as 25 %, and percentage of clay as 45 % in Figure (5.1) and mark the point of intersection of three lines.
Show the percentage of sand, silt, and clay of soil H as in Figure (8).
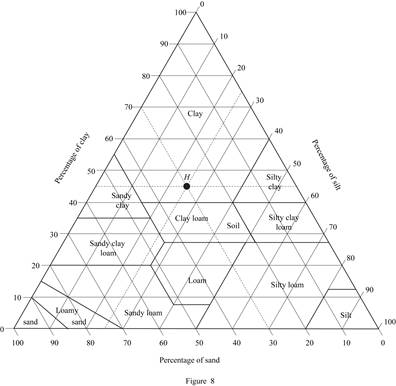
Refer Figure (8).
The classification of soil H as per the United States department of agriculture textural classification chart is
Consider soil I:
Mark the percentage of sand for soil I as 5 %, percentage of silt as 45 %, and percentage of clay as 50 % in Figure (5.1) and mark the point of intersection of three lines.
Show the percentage of sand, silt, and clay of soil I as in Figure (9).
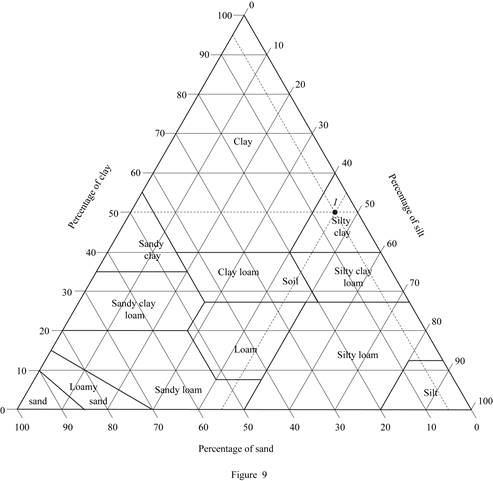
Refer Figure (9).
The classification of soil I as per the United States department of agriculture textural classification chart is
Consider soil J:
Mark the percentage of sand for soil J as 45 %, percentage of silt as 45 %, and percentage of clay as 10 % in Figure (5.1) and mark the point of intersection of three lines.
Show the percentage of sand, silt, and clay of soil J as in Figure (10).
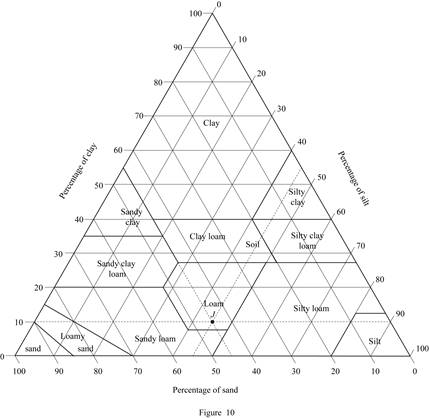
Refer Figure (10).
The classification of soil J as per the United States department of agriculture textural classification chart is
Want to see more full solutions like this?


- 10.37 What is ffor the flow of water at 10°C through a 30-cm cast iron pipe with a mean velocity of 24 m/s?arrow_forward10.60 As shown, water (15°C) is draining from a tank through a galvanized iron pipe. The pipe length is L = 2 m, the tank depth is H = 1 m, and the pipe is a 0.5-inch NPS schedule 40. Calculate the velocity in the pipe. Neglect component head loss. H Pipe of diameter D L Problems 10.59 and 10.60arrow_forward10.53 Water is pumped through a vertical 10-cm new steel pipe to an elevated tank on the roof of a building. The pressure on the discharge side of the pump is 1.6 MPa. What pressure can be expected at a point in the pipe 110 m above the pump when the flow is 0.02 m³/s? Assume T = 20°C.arrow_forward
- 10.61 A pipeline is to be designed to carry crude oil (SG = 0.93, v = 10-5 m²/s) with a discharge of 0.10 m³/s and a head loss per kilometer of 50 m. What diameter of steel pipe is needed? What power output from a pump is required to maintain this flow? Available pipe diameters are 20, 22, and 24 cm.arrow_forwardCalculate the active earth pressure (exerted by the supported soil mass on the right) against the 10-meter-long, dense and smooth sheet pile wall shown in Figure E2:1. The ground surface is loaded with heavy construction machinery applying a pressure of q = 10.0 kPa. Other data is according to the figure.Assume the sheet pile moves sufficiently to the left to reach active failure conditions behind it, and passive failure conditions develop in the soil mass below the excavation bottom. Will the sheet pile wall hold without rain? (Calculate the forces.) Will the sheet pile wall hold if it rains? (Assume water-filled cracks.) If the sheet pile does not hold in any of the above cases – how deep would it need to be embedded in order to hold? Draw diagrams for active and passive earth pressure as well as the resultant earth pressure. gvy=grownd water levelarrow_forwardThe composite beam shown in the figure is subjected to a bending moment Mz=8 kNmMz=8kNm.The elastic moduli for the different parts are E1=30 GPa, E2=20 GPa, and E3=60GPa. a) Determine the reduced moment of inertia IredIred for the entire beam. b) Sketch the bending stress distribution in the beam.arrow_forward
- USING THE ATTACHED SKETCH , DETERMINE THE FOLLOWING: 1. INVERSE DISTANCE, NORTH AZIMUTH AND BEARING BETWEEN CP-102 AND THE SOUTHWEST BUILDING CORNER.2. DETERMINE THE INTERIOR ANGLE AT CP-101 - CP-102 AND THE SOUTHWEST BUILDING CORNER.3. WHAT ARE THE COORDINATES (N,E) AT POINT A AND POINT B IN THE ATTACHED SKETCH?arrow_forwardGiven the following Right Triangle, find the " Area by Coordinates" (Not B*H/2). Report to the nearest Sq. Ft. and to the nearest thousandth of an acre.arrow_forward1) 4,739,281 SQ.FT. = ______________________ ACRES? 2) S 90°00'00" W IS ALSO KNOW AS WHAT CARDINAL DIRECTION? 3) CALCULATE THE NORTH AZIMUTH (NAZ) OF THE FOLLOWING BEARINGS: N 31° 22' 22" E=___________________________NAZ? S 87° 29' 17" W=___________________________NAZ? S 27° 43' 27" E=___________________________NAZ? N 43° 17' 43" E=___________________________NAZ?arrow_forward
- 1) 187.25597°=_____________________________________(DEG-MIN-SEC FORMAT)? 2) CALCULATE THE BEARING AND DIRECTION IN DEG-MIN-SEC OF THE FOLLOWING: NAZ 142°49'18"=____________________________(BEARING/DIRECTION DEG-MIN-SEC)? NAZ 180°00'00"=____________________________(BEARING/DIRECTION DEG-MIN-SEC)? NAZ 270°00'00"=____________________________(BEARING/DIRECTION DEG-MIN-SEC)?arrow_forwardA traffic signal has a 60-second cycle length (Red time + Green time). For the travel direction of interest, the red and green times are 30 seconds each, the arrival rate is constant at 20 [veh/min] and the saturation flow (i.e., the departure rate) is 1 [veh/sec]. a. Calculate the average delay (for all vehicles) for the travel direction of interest. b. Assume a work zone on the street downstream of the intersection so that only 25 [veh/min] (in the direction of interest) can pass. Calculate the average delay caused by the work zone to a vehicle leaving the intersection. Assume that the queue at the work zone never backs- up into the intersection. c. Discuss qualitatively the implications of queue spillback from the work zone on the delay of the system. Traffic Direction (a) Traffic Direction (b)arrow_forwardCalculate the active earth pressure (exerted by the supported soil mass on the right) against the 10-meter-long, dense and smooth sheet pile wall shown in Figure E2:1. The ground surface is loaded with heavy construction machinery applying a pressure of q = 10.0 kPa. Other data is according to the figure.Assume the sheet pile moves sufficiently to the left to reach active failure conditions behind it, and passive failure conditions develop in the soil mass below the excavation bottom. Draw diagrams for active and passive earth pressure as well as the resultant earth pressure. Questions to Answer: Will the sheet pile wall hold without rain? (Calculate the forces.) Will the sheet pile wall hold if it rains? (Assume water-filled cracks.) If the sheet pile does not hold in any of the above cases – how deep would it need to be embedded in order to hold?arrow_forward
 Construction Materials, Methods and Techniques (M...Civil EngineeringISBN:9781305086272Author:William P. Spence, Eva KultermannPublisher:Cengage Learning
 Principles of Geotechnical Engineering (MindTap C...Civil EngineeringISBN:9781305970939Author:Braja M. Das, Khaled SobhanPublisher:Cengage Learning
 Fundamentals of Geotechnical Engineering (MindTap...Civil EngineeringISBN:9781305635180Author:Braja M. Das, Nagaratnam SivakuganPublisher:Cengage Learning
 Principles of Foundation Engineering (MindTap Cou...Civil EngineeringISBN:9781337705028Author:Braja M. Das, Nagaratnam SivakuganPublisher:Cengage Learning
 Fundamentals Of Construction EstimatingCivil EngineeringISBN:9781337399395Author:Pratt, David J.Publisher:Cengage,
 Principles of Foundation Engineering (MindTap Cou...Civil EngineeringISBN:9781305081550Author:Braja M. DasPublisher:Cengage Learning