
Concept explainers
a.
The
Introduction: Consumer surplus refers to the additional profit a consumer gets due to the difference between the price of a commodity in the market and the price a consumer is ready to give for a particular commodity at a given period of time.
Producer surplus on the other hand is the additional surplus of the producers due to the difference in the price of a good at which the producer wants to the supply with the prices the consumers are ready to pay for a commodity in the market at a particular period of time.
Total surplus is the total sum of the consumer as well as the producer surplus in an economy in a given period of time. Total surplus is also referred to as the economic surplus.
Price floor refers to the minimum prices decided by the government of a country so as to minimize the change in the price of commodities.
Explanation of Solution
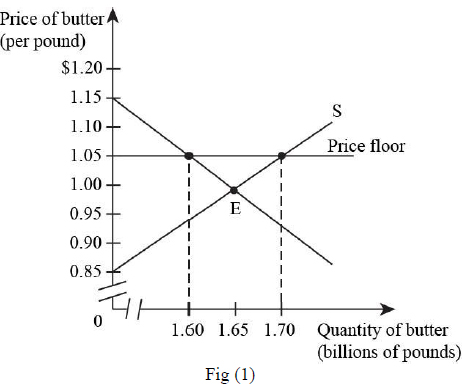
The diagram given below depicts the quantity demanded and quantity supplied of butter in billion pounds:
The consumer surplus in the absence of
Formula to calculate consumer surplus is as follows:
Substitute, $0.25 for the price above equilibrium, 0.15 for equilibrium price and $200 for the
Hence, consumer surplus is $10 billion.
Similarly, producer surplus can be calculated with the area above the supply curve but below the equilibrium prices.
Formula to calculate producer surplus is as follows:
Substitute 0.15 for the equilibrium price, 0.05 for the price below equilibrium price and $200 billion for equilibrium quantity demanded in the above formula,
Hence, producer surplus is $10 billion.
Thus, formula to calculate total surplus is as follows:
Substitute $10 billion for consumer surplus and $10 billion for producer surplus in the formula.
Hence, the total surplus is $20 billion.
b.
Consumer surplus if price floor is at $0.18 and consumer buy 140 billion pounds of milk.
Explanation of Solution
If price floor is set at $0.18 per pound, the consumer will purchase at the prices above the price floor but below the maximum price level that is $0.25 as shown in the figure 1.
The formula to calculate consumer surplus as per this explanation is as follows:
Substitute $0.25 for the maximum price, $0.18 for the floor price and 200 billion for the equilibrium quantity in the above formula,
Hence, the consumer surplus is $47 billion.
c.
The amount of producer surplus if price floor is at $0.18 per pound of milk and producers tend to sell 240 billion pounds of milk.
Explanation of Solution
With the price floor set, the producers tend to fix the sale of milk at 240 billion pounds. With this increased quantity more than the equilibrium quantity that was 1.65 billion.
Formula to calculate producer surplus is as follows:
Substitute 0.18 for floor price, 0.05 for lowest price and 240 billion for sales in the formula.
Hence, the producer surplus is $15.6 billion.
d.
The money spent by the USDA (U.S. Department of Agriculture) to buy surplus milk.
Explanation of Solution
The USDA has to buy 240 million pounds of milk.
Formula to calculate the money spends to buy 240billion pounds of milk is as follows:
Substitute, 0.18 for floor price and 240 billion for sales volume in the formula,
Hence, the amount of money spent is $43.2 billion.
e.
The total surplus in case of price floor and analyze the difference in the total surplus with price without a price floor.
Explanation of Solution
In case price floor is set by the government, the formula to calculate total surplus is as follows:
Substitute, 47 Billion for consumer surplus, $15.6 Billion for producer surplus and $43.2 Billion for the money spent in the formula,
Hence, the total surplus is $19.4 billion.
The total surplus in an economy when price floor is set by the government is less as compared to the total surplus before the advent of price floor. This is because of the reduction in both the producer as well as the consumer surplus in the economy.
Want to see more full solutions like this?


- On the 1st of April 2018, the South African National Treasury increase the value-added tax rate from 14% to 15%. This policy change had a wide-ranging impact on society. Discuss some of the benefits and drawbacks of making use of this type of tax to generate government revenue and what we may expect in terms of its impact on inflation and GDP growth within the economy.arrow_forward5. We learnt the following equation in the class: Ak = sy - (n + 8)k where y = ko. Now, I transform this equation into: Ak/k = sy/k - (n + 8). I want you to use a diagram to show the steady state solution of this equation (In the diagram, there will be two curves - one represents sy/k and one represents (n + 8). In the steady state, of course, Ak/k = 0). In this diagram, the x-axis is k. What will happen to this diagram if the value of n increases?arrow_forwardNot use ai pleasearrow_forward
- 3. A country has the following production function: Y = K0.2L0.6p0.2 where Y is total output, K is capital stock, L is population size and P is land size. The depreciation rate (8) is 0.05. The population growth rate (n) is 0. We define: y = ½, k = 1 and p = . Land size is fixed. L a) Find out the steady state values of k and y in terms of p, the per capita land size.arrow_forwardNot use ai please letarrow_forwardConsider the market for sweaters in a Hamilton neighbourhood shown in the figure to the right. The consumer surplus generated by consuming the 29th sweater is OA. $67.90. OB. $58.20. ○ C. $77.60. OD. $38.80. ○ E. $19.50. Price ($) 97 68.0 48.5 29.0 29.0 Sweater Market 48.5 Quantity (Sweaters per week)arrow_forward
- Not use ai pleasearrow_forwardIn the following table, complete the third column by determining the quantity sold in each country at a price of $18 per toy train. Next, complete the fourth column by calculating the total profit and the profit from each country under a single price. Price Single Price Quantity Sold Price Discrimination Country (Dollars per toy train) (Millions of toy trains) Profit (Millions of dollars) Price (Dollars per toy train) Quantity Sold (Millions of toy trains) Profit (Millions of dollars) France 18 Russia 18 Total N/A N/A N/A N/A Suppose that as a profit-maximizing firm, Le Jouet decides to price discriminate by charging a different price in each market, while its marginal cost of production remains $8 per toy. Complete the last three columns in the previous table by determining the profit-maximizing price, the quantity sold at that price, the profit in each country, and total profit if Le Jouet price discriminates. Le Jouet charges a lower price in the market with a relatively elastic…arrow_forwardNot use ai pleasearrow_forward
- Not dhdjdjdjduudnxnxjfjfi feverarrow_forwardDiscuss the different types of resources (natural, human, capital) and how they are allocated in an economy. Identify which resources are scarce and which are abundant, and explain the implications of this scarcity or abundance.arrow_forwardNot use ai pleasearrow_forward

 Principles of Economics (12th Edition)EconomicsISBN:9780134078779Author:Karl E. Case, Ray C. Fair, Sharon E. OsterPublisher:PEARSON
 Engineering Economy (17th Edition)EconomicsISBN:9780134870069Author:William G. Sullivan, Elin M. Wicks, C. Patrick KoellingPublisher:PEARSON
 Principles of Economics (MindTap Course List)EconomicsISBN:9781305585126Author:N. Gregory MankiwPublisher:Cengage Learning
 Managerial Economics: A Problem Solving ApproachEconomicsISBN:9781337106665Author:Luke M. Froeb, Brian T. McCann, Michael R. Ward, Mike ShorPublisher:Cengage Learning
 Managerial Economics & Business Strategy (Mcgraw-...EconomicsISBN:9781259290619Author:Michael Baye, Jeff PrincePublisher:McGraw-Hill Education