
Videos
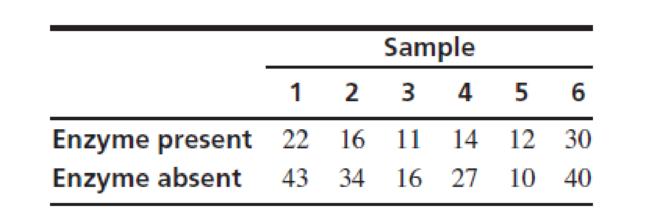
A molecular biologist is studying the effectiveness of a particular enzyme to digest a certain sequence of DNA nucleotides. He divides six DNA samples into two parts, treats one part with the enzyme, and leaves the other part untreated. He then uses a polymerase chain reaction assay to count the number of DNA fragments that contain the given sequence. The results are as follows:
Find a 95% confidence interval for the difference between the
Find the 95% confidence interval for the difference between the mean number of fragments.
Answer to Problem 1SE
The 95% confidence interval for the difference between the mean number of fragments is
Explanation of Solution
Given info:
In the study, six DNA samples into two parts, treats one part with the enzyme and leaves the other part untreated. Also, count the number of DNA fragments that contain the given sequence.
Calculation:
Confidence interval:
Software Procedure:
Step-by-step procedure to obtain the confidence interval using the MINITAB software:
- Choose Stat > Basic Statistics > Paired t.
- In First Sample, enter the column of Enzyme absent.
- In Second Sample, enter the column of Enzyme present.
- Check Options; enter Confidence level as 95%.
- Choose not equal in alternative.
- Click OK.
Output using the MINITAB software is given below:
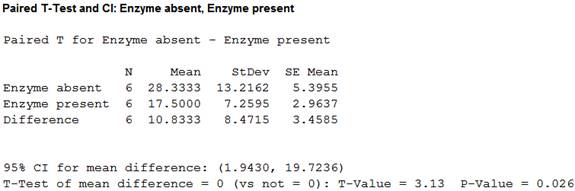
From the output, the 95% confidence interval for the difference between the mean number of fragments is
Want to see more full solutions like this?
Chapter 5 Solutions
Statistics for Engineers and Scientists


- A company found that the daily sales revenue of its flagship product follows a normal distribution with a mean of $4500 and a standard deviation of $450. The company defines a "high-sales day" that is, any day with sales exceeding $4800. please provide a step by step on how to get the answers in excel Q: What percentage of days can the company expect to have "high-sales days" or sales greater than $4800? Q: What is the sales revenue threshold for the bottom 10% of days? (please note that 10% refers to the probability/area under bell curve towards the lower tail of bell curve) Provide answers in the yellow cellsarrow_forwardFind the critical value for a left-tailed test using the F distribution with a 0.025, degrees of freedom in the numerator=12, and degrees of freedom in the denominator = 50. A portion of the table of critical values of the F-distribution is provided. Click the icon to view the partial table of critical values of the F-distribution. What is the critical value? (Round to two decimal places as needed.)arrow_forwardA retail store manager claims that the average daily sales of the store are $1,500. You aim to test whether the actual average daily sales differ significantly from this claimed value. You can provide your answer by inserting a text box and the answer must include: Null hypothesis, Alternative hypothesis, Show answer (output table/summary table), and Conclusion based on the P value. Showing the calculation is a must. If calculation is missing,so please provide a step by step on the answers Numerical answers in the yellow cellsarrow_forward
 Glencoe Algebra 1, Student Edition, 9780079039897...AlgebraISBN:9780079039897Author:CarterPublisher:McGraw Hill
 Holt Mcdougal Larson Pre-algebra: Student Edition...AlgebraISBN:9780547587776Author:HOLT MCDOUGALPublisher:HOLT MCDOUGAL
 College Algebra (MindTap Course List)AlgebraISBN:9781305652231Author:R. David Gustafson, Jeff HughesPublisher:Cengage Learning