Concept explainers
Videos
(a) Draw two typical curves y = f(x) and y = g(x), where f(x) … g(x) for a „ x „ b. Show how to approximate the area between these curves by a Riemann sum and sketch the corresponding approximating rectangles. Then write an expression for the exact area.
(b) Explain how the situation changes if the curves have equations x = f(y) and x = g(y), where f(y) … g(y) for c „ y „ d.
(a)
To Draw: the two typical curves
To define: A Riemann sum that approximates the area between the two typical curves with drawing of the corresponding approximating rectangles and exact area between the two typical curves and the expression for the exact area.
Explanation of Solution
Consider the two curves
Here, the top curve function is
Assume f and g are continuous function and
Here, the lower limit is a and the upper limit is b.
Show the approximate ith strip rectangle with base
Sketch the two typical curves
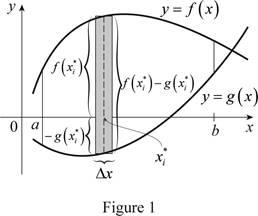
Refer to figure 1.
The two typical curves
The expression for the exact area is
Divide the area between the two typical curves into n strips of equal width and take the entire sample points to be right endpoints, in which
Sketch thecorresponding approximating rectangles as shown in Figure 2.
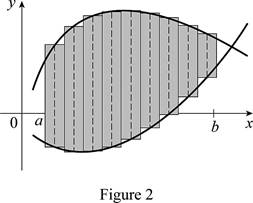
The better and better approximation occurs in
Thus, the Riemann sum with the sketch of corresponding approximating rectangles and the exact area between the two typical curves shown.
Therefore, the approximation of the area between the two typical curves using Riemann sum with the sketch of the corresponding approximating rectangles and the sum of the areas corresponding approximating rectangles is the exact area.
(b)
To Draw: The two typical curves with the changing the situation as
To define: The situation if the curves changes from
The expression for the exact area is
Explanation of Solution
Consider the two curves
Here, the right curve function is
Assume f and g are continuous function and
Here, the bottom limit is c and the top limit is d.
Sketch the two typical curves
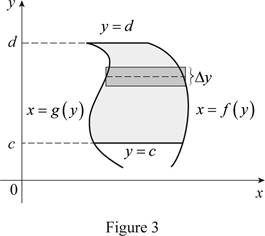
Thus, the two typical curves
Normally the height calculated from the top function minus bottom one and integrating from left to right. Instead of normal calculation, use “right minus left” and integrating from bottom to top. Therefore the exact area, A written as
Therefore, the changes of the situation if the curves have equations
Want to see more full solutions like this?
Chapter 5 Solutions
Single Variable Calculus


- Please help me with this question as I want to know how can I perform the partial fraction on this alebgric equation to find the time-domain of y(t)arrow_forwardEvaluate F³ - dr where ♬ = (4z, -4y, x), and C' is given by (t) = (sin(t), t, cos(t)), 0≤t≤ñ .arrow_forwardMid-Term Review Find the formula for (f + g)(x). f(x) = x² - 10x + 25 and g(x) = x² - 10x + 24 (f + g) (x) = [ 2 ]x² X + DELL Skip Sarrow_forward
- Calculus III May I please have some elaborations on Example 2 part a? Thank you.arrow_forward1. A bicyclist is riding their bike along the Chicago Lakefront Trail. The velocity (in feet per second) of the bicyclist is recorded below. Use (a) Simpson's Rule, and (b) the Trapezoidal Rule to estimate the total distance the bicyclist traveled during the 8-second period. t 0 2 4 6 8 V 10 15 12 10 16 2. Find the midpoint rule approximation for (a) n = 4 +5 x²dx using n subintervals. 1° 2 (b) n = 8 36 32 28 36 32 28 24 24 20 20 16 16 12 8- 4 1 2 3 4 5 6 12 8 4 1 2 3 4 5 6arrow_forward= 5 37 A 4 8 0.5 06 9arrow_forward
- Consider the following system of equations, Ax=b : x+2y+3z - w = 2 2x4z2w = 3 -x+6y+17z7w = 0 -9x-2y+13z7w = -14 a. Find the solution to the system. Write it as a parametric equation. You can use a computer to do the row reduction. b. What is a geometric description of the solution? Explain how you know. c. Write the solution in vector form? d. What is the solution to the homogeneous system, Ax=0?arrow_forward2. Find a matrix A with the following qualities a. A is 3 x 3. b. The matrix A is not lower triangular and is not upper triangular. c. At least one value in each row is not a 1, 2,-1, -2, or 0 d. A is invertible.arrow_forwardFind the exact area inside r=2sin(2\theta ) and outside r=\sqrt(3)arrow_forward
- A 20 foot ladder rests on level ground; its head (top) is against a vertical wall. The bottom of the ladder begins by being 12 feet from the wall but begins moving away at the rate of 0.1 feet per second. At what rate is the top of the ladder slipping down the wall? You may use a calculator.arrow_forwardExplain the focus and reasons for establishment of 12.4.1(root test) and 12.4.2(ratio test)arrow_forwarduse Integration by Parts to derive 12.6.1arrow_forward
 Algebra & Trigonometry with Analytic GeometryAlgebraISBN:9781133382119Author:SwokowskiPublisher:Cengage
