
The elastic-rebound theory of faulting through a sketched map and the way it has been modified in recent years.
Answer to Problem 1QR
The elastic-rebound theory explains movement of faults by the rupture in rock through overpowering stress caused by Earth. The modification in this theory suggests that a considerable time is required to create another earthquake after a big earthquake.
Explanation of Solution
Pictorial representation: Fig.1 shows the elastic-rebound theory where (a) represents an active fault with a road, (b) represents occurrence of deformation along the fault, and (c) represents the final occurrence of deformation.
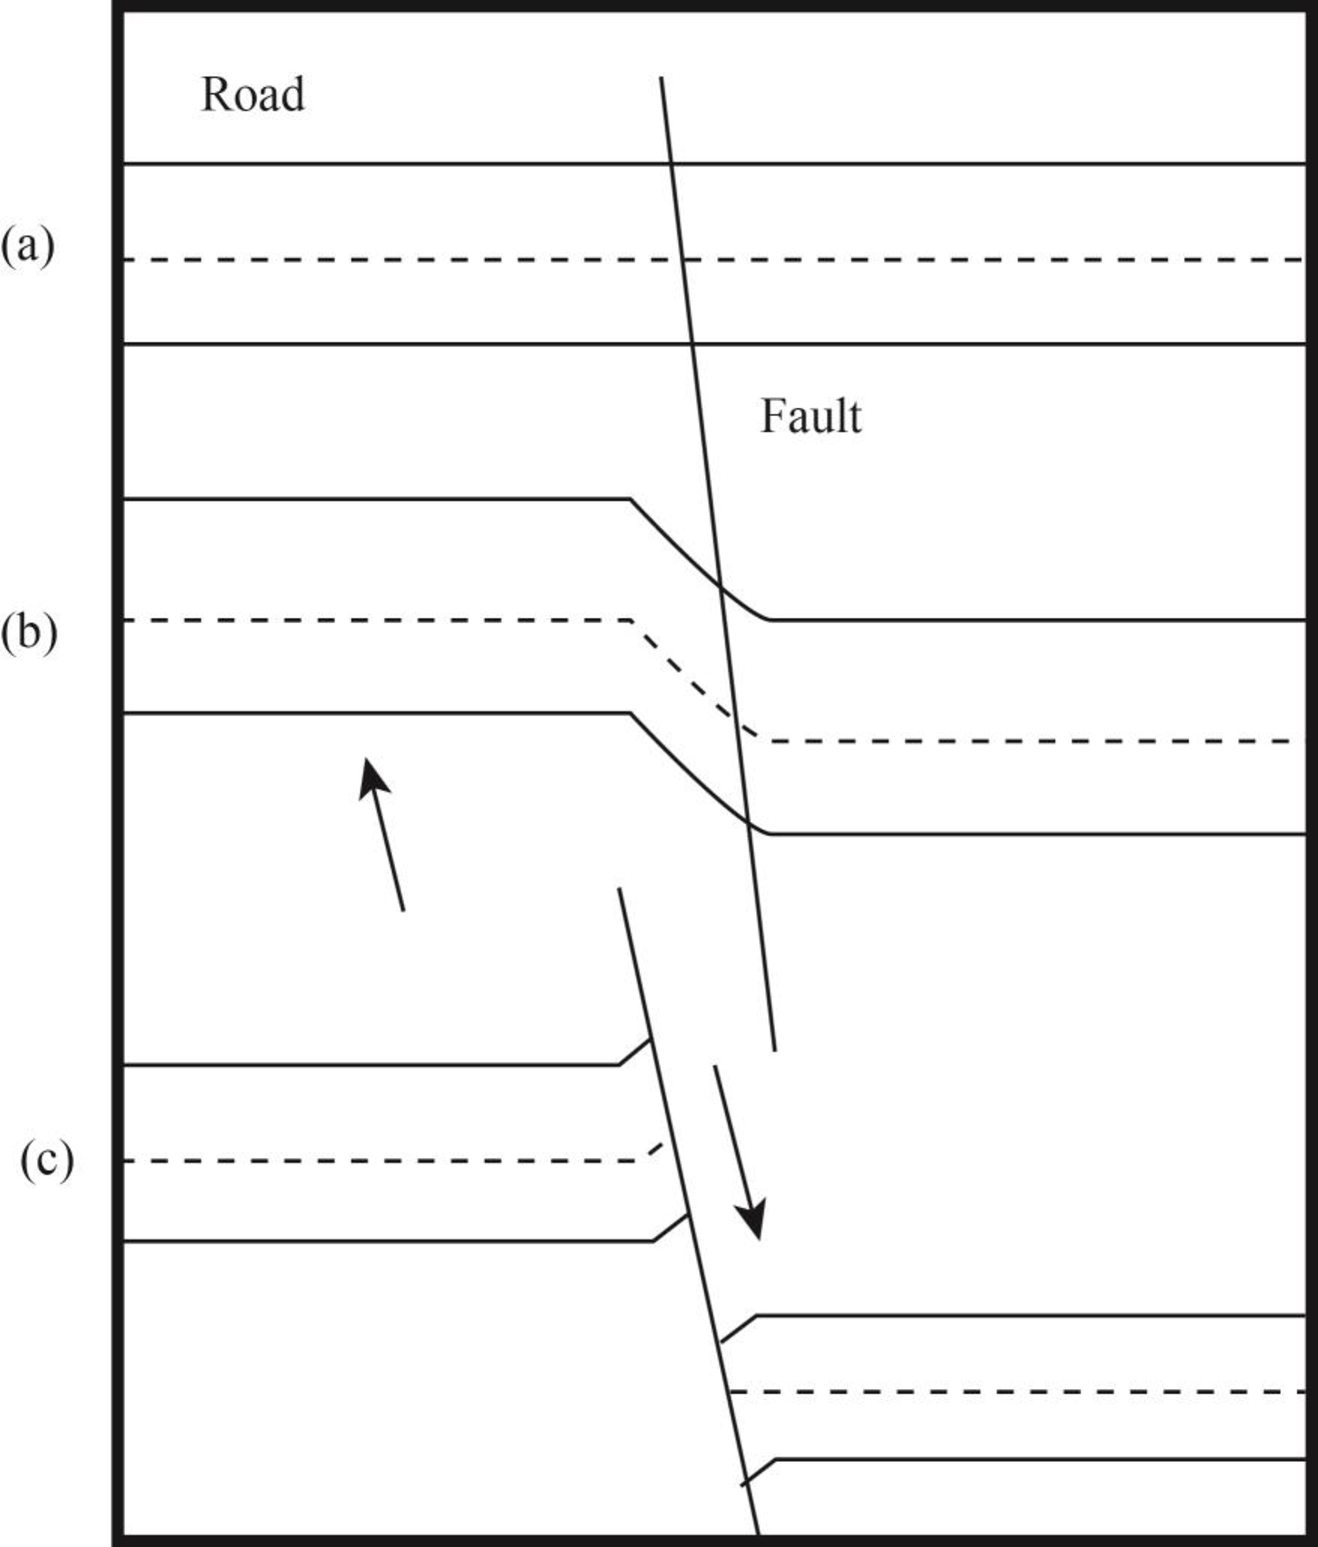
Fig.1 Schematic representation of elastic-rebound theory
After the San Francisco earthquake, the elastic-rebound theory was developed to explain movement of faults. According to seismic studies from San Andreas faults, the stress of Earth causes deformation and movement around both sides of a fault. However, rocks do not move due to this stress along the fault because of their roughness and irregularity. It results in the retardation of the movement of rocks with friction by making strong interlocking bonds. The land masses that are far from faults continue to move. The overpowering stress causes rupture in rocks at fault and both sides of fault move forward to catch or pass the rock which is away from fault. After this movement of fault, complete elastic strain is removed and new one is build up.
The former elastic bound theory still works but some modifications have emerged in recent years. These modifications suggest that most of the elastic strain is removed from the rocks after a large earthquake. A considerable time is needed to build a strain high enough to create another big earthquake.
Want to see more full solutions like this?
Chapter 5 Solutions
EBK NATURAL DISASTERS

- I need help with part A, B and Carrow_forwardDiscussion Question: Atmospheric Water & Weather A+ This chapter beautifully focuses on water from the small molecular scale to large-scale weather patterns. The surplus of heat at the equator and the deficit at the Poles drives our atmospheric instability. Instability is a good thing! Without the unstable conditions, there would not be any atmospheric motion. The overheating of the equator pumps atmospheric uplift. As the air rises into lower pressures, it expands and cools... adiabatic cooling! The air migrates north and south and becomes denser than the surrounding air and sinks. The sinking air enters higher pressures and creates the subtropical high pressures and adiabatic heating...whaaaa-la! We have Hadley Cells! Not to mention, the Rainforests and World's largest deserts too! We now can imagine the Hadley cells in three-dimensions. They more or less "sandwich" the equator during the spring and fall equinoxes. However, what happens in the summer and winter? mP Maritime polar…arrow_forwardUsing the map. Solve part e f garrow_forward
- Answer the below questions in detail using the attached pictures. Please ensure it is all 100% done by human, please do not use AI or chatgpt. using the provided hydraulic head data (attached spreadsheet), plot the values at their corresponding piezometer locations (attached piezometer map), contour the head data to create equipotential lines that allow you to demonstrate the groundwater flow direction, indicate the flow direction with arrows, provide comments/observations about the characteristics of the groundwater flow system, for example, are the equipotential lines equally spaced? If not, can you comment on why there are areas with close spacing and other areas with wide spacing? Are there any areas where the aquifer displays artesian conditions? If so, where?arrow_forwardPlease answer the question in detail. Please ensure it is 100% done by human, please do not use AI or chatgpt. Organize your spreadsheets carefully and make sure they are easy to follow. Make sure that your units are consistent, use SI units and make sure your graphs are clear and well labelled.arrow_forwardPlease answer each question in detail. Please ensure it is 100% done by human, please do not use AI or chatgpt.arrow_forward
- I need help on this questionarrow_forwardPlease answer the question in detail. Please ensure it is 100% done by human, please do not use AI or chatgpt.arrow_forwardAnswer the below questions in detail using the attached pictures using the provided hydraulic head data (attached spreadsheet), plot the values at their corresponding piezometer locations (attached piezometer map), contour the head data to create equipotential lines that allow you to demonstrate the groundwater flow direction, indicate the flow direction with arrows, provide comments/observations about the characteristics of the groundwater flow system, for example, are the equipotential lines equally spaced? If not, can you comment on why there are areas with close spacing and other areas with wide spacing? Are there any areas where the aquifer displays artesian conditions? If so, where?arrow_forward
- Please answer the three questions in detail and as best as you can. plotting grain-size distribution curves from the grain data provided, calculating D10 values for each sample and using it to estimate the hydraulic conductivity, calculating the porosity for each sample Please ensure it is 100% done by human, please do not use AI or chatgpt.arrow_forwardPlease answer the question in detail. Please ensure it is 100% done by human, please do not use AI or chatgpt.arrow_forwardActivity 9.4 Depositional Features of Glaciers Pg 158Use Figure 9.7, which illustrates a hypothetical retreating glacier, to complete the following. 1. As a glacier retreats, it sometimes stalls and deposits a recessional end moraine. Label the recessional end moraine on Figure 9.7. 2. On Figure 9.7, label an area covered by ground moraine. 3. On Figure 9.7, fill in the appropriate blanks with the names of the following depositional features: kettle lake, kame, drumlin, esker, and outwash plain. 4. Which area is composed of stratified drift: the ground moraine or the outwash plain? Activity 9.5 Depositional Features Associated with Ice Sheets Pgs 159-1611. After examining the map and stereogram, draw a line on the map to outline the area illustrated on the stereogram. 2. What evidence on the map indicates that portions of the area are poorly drained? On what part of the map are these features located? 3. Use Figure 9.11 to draw a topographic profile of the X-Y line on Figure 9.10.…arrow_forward
 Applications and Investigations in Earth Science ...Earth ScienceISBN:9780134746241Author:Edward J. Tarbuck, Frederick K. Lutgens, Dennis G. TasaPublisher:PEARSON
 Exercises for Weather & Climate (9th Edition)Earth ScienceISBN:9780134041360Author:Greg CarbonePublisher:PEARSON
 Environmental ScienceEarth ScienceISBN:9781260153125Author:William P Cunningham Prof., Mary Ann Cunningham ProfessorPublisher:McGraw-Hill Education
 Earth Science (15th Edition)Earth ScienceISBN:9780134543536Author:Edward J. Tarbuck, Frederick K. Lutgens, Dennis G. TasaPublisher:PEARSON
 Environmental Science (MindTap Course List)Earth ScienceISBN:9781337569613Author:G. Tyler Miller, Scott SpoolmanPublisher:Cengage Learning
 Physical GeologyEarth ScienceISBN:9781259916823Author:Plummer, Charles C., CARLSON, Diane H., Hammersley, LisaPublisher:Mcgraw-hill Education,