
(a)
To show:
The effect on the market for wheat in the given case with the help of the
Answer to Problem 1P
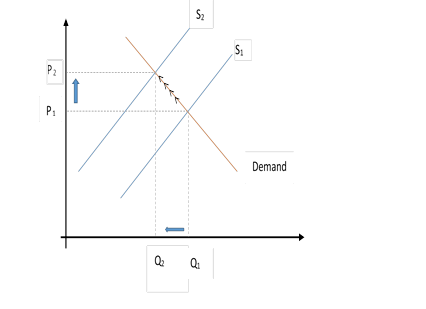
The market for wheat will see a decrease in supply. This is due to the unfavorable weather condition which will result into a higher
Explanation of Solution
The unfavorable weather condition brings a situation where there is a limitation in the supply of the wheat crop leading to an increase in price of the crop. As in
If there is a decrease in supply of wheat, then the price will go up, which will result to lowering demand that will lead to new equilibrium,
When the supply of crop of wheat falls from S1to S2due to floods, then there will be a rise in price from P1to P2.
Demand and supply curve:
Demand and supply curve represents the relationship between the quantities of the product a supplier supplies in the market and the quantity of the product a consumer demands. The point where the supply and demand curve meets are referred to as the equilibrium price.
(b)
To show:
The effect on the market for wheat in the given case with the help of the supply and demand curve.
Answer to Problem 1P
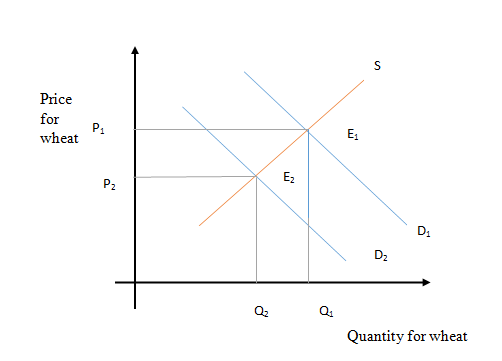
Corn is a substitute for wheat, and there is a decrease in price for corn.There will be reduction in demand for wheat resulting in a decrease of price and quantity of wheat.
When a substitute is available in the market for a product in lower price then there will be chances of drop in the demand of that product. As corn is a substitute of wheat, fall in the price of corn will lead to a decrease in demand for wheat, resulting in leftward shift of demand curve. The prices and quantity of wheat will go down causing new equilibrium, E2.
In this case, it could be seen that with decrease of demand of wheat from D1to D2, there will be a shift in price of wheat too from P1 to P2.
(c)
To show:
The effect on the market for wheat in the given case with the help of the supply and demand curve.
Demand and supply curve:
Demand and supply curve represents the relationship between the quantities of product a supplier supplies in the market and quantity of product a consumer demand. The point where the supply and demand curves meet is referred to as the equilibrium price. This is the price at which a supplier agrees to supply the commodities and the consumers agree to buy.
If it is a favorable weather condition for wheat, it would result to the increase in the production of wheat, leading into the increase in the supply of wheat.
In the given case, initial equilibrium is represented with
With the increase of supply in wheat, there will be lower equilibrium of price represented by
(d)
To show:
The effect on the market for wheat in the given case with the help of the supply and demand curve.
Demand and supply curve:
Demand and supply curve represents the relationship between the quantities of product a supplier supplies in the market and quantity of product a consumer demands. The point where the supply and demand curves meet is referred to as the equilibrium price. This is the price at which a supplier agrees to supply the commodities and the consumers agree to buy.
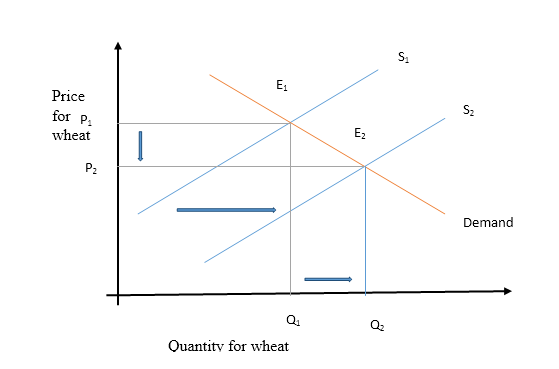
With the falling price of fertilizers, there will be an increase in the supply of wheat. This will result into dipping of the price of wheat and increase in the equilibrium quantity traded.
Fertilizer is one of the core component in agriculture. Any change in price of the fertilizers would affect the demand and supply condition of crop too. With the fall in price of fertilizers, the cost of producing wheat will go down that will lead to increase in supply. As a result of increase in supply, price of wheat will go down, but the movement of supply curve will outweigh the movement of price leading into equilibrium price of wheat to fall (from P1 to P2).
In the graph, there is a rise in supply from S1to S2, which will lead to a fall in the price from P1to P2.
(e)
To show:
The effect on the market for wheat in the given case with the help of the supply and demand curve.
Demand and supply curve:
Demand and supply curve represents the relationship between the quantities of product a supplier supplies in the market and quantity of product a consumer demand. The point where the supply and demand curves meet is referred to as the equilibrium price. This is the price at which a supplier agrees to supply the commodities and the consumers agree to buy.
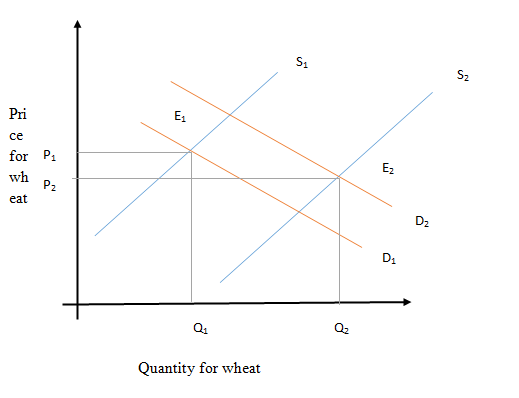
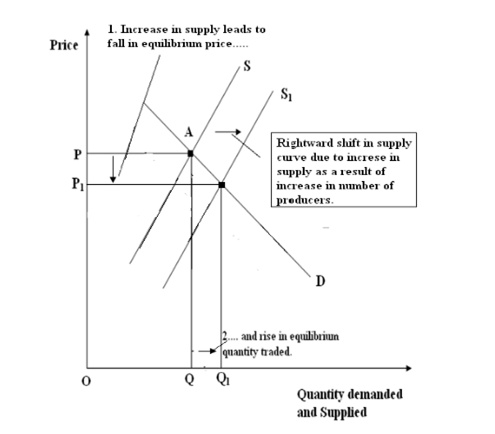
With the involvement of more individual in growing wheat there will be increase in supply of wheat. This will result into price of wheat dipping.
The initial equilibrium is at point A.With increase in wheat growers the supply of the wheat will also increase. The initial supply curve will shift rightwards from S to S1,the change in supply will form new equilibrium at point B, by intersection of new supply curve S1and demand curve D.
Due to the increase in supply of wheat, the price will decrease from P to P1with increase in equilibrium quantity traded at Q1.
Explanation of Solution
When a substitute is available in the market for a product in lower price then there will be chances of drop in the demand of that product. As corn is a substitute of wheat, fall in the price of corn will lead to a decrease in demand for wheat, resulting in leftward shift of demand curve. The prices and quantity of wheat will go down causing new equilibrium, E2.
In this case, it could be seen that with decrease of demand of wheat from D1to D2, there will be a shift in price of wheat too from P1 to P2.
Demand and supply curve:
Demand and supply curve represents the relationship between the quantities of product a supplier supplies in the market and the quantity of product a consumer demands. The point where the supply and demand curves meet is referred to as the equilibrium price. This is the price at which a supplier agrees to supply the commodities and the consumers agree to buy.
(c)
To show:
The effect on the market for wheat in the given case with the help of the supply and demand curve.
Answer to Problem 1P
If it is a favorable weather condition for wheat, it would result to the increase in the production of wheat, leading into the increase in the supply of wheat.
Explanation of Solution
In the given case, initial equilibrium is represented with
With the increase of supply in wheat, there will be lower equilibrium of price represented by
Demand and supply curve:
Demand and supply curve represents the relationship between the quantities of product a supplier supplies in the market and quantity of product a consumer demand. The point where the supply and demand curves meet is referred to as the equilibrium price. This is the price at which a supplier agrees to supply the commodities and the consumers agree to buy.
(d)
To show:
The effect on the market for wheat in the given case with the help of the supply and demand curve.
Answer to Problem 1P
With the falling price of fertilizers, there will be an increase in the supply of wheat. This will result into dipping of the price of wheat and increase in the equilibrium quantity traded.
Explanation of Solution
Fertilizer is one of the core component in agriculture. Any change in price of the fertilizers would affect the demand and supply condition of crop too. With the fall in price of fertilizers, the cost of producing wheat will go down that will lead to increase in supply. As a result of increase in supply, price of wheat will go down, but the movement of supply curve will outweigh the movement of price leading into equilibrium price of wheat to fall (from P1 to P2).
In the graph, there is a rise in supply from S1to S2, which will lead to a fall in the price from P1to P2.
Demand and supply curve:
Demand and supply curve represents the relationship between the quantities of product a supplier supplies in the market and quantity of product a consumer demands. The point where the supply and demand curves meet is referred to as the equilibrium price. This is the price at which a supplier agrees to supply the commodities and the consumers agree to buy.
(e)
To show:
The effect on the market for wheat in the given case with the help of the supply and demand curve.
Answer to Problem 1P
With the involvement of more individual in growing wheat there will be increase in supply of wheat. This will result into price of wheat dipping.
Explanation of Solution
The initial equilibrium is at point A.With increase in wheat growers the supply of the wheat will also increase. The initial supply curve will shift rightwards from S to S1,the change in supply will form new equilibrium at point B, by intersection of new supply curve S1and demand curve D.
Due to the increase in supply of wheat, the price will decrease from P to P1with increase in equilibrium quantity traded at Q1.
Demand and supply curve:
Demand and supply curve represents the relationship between the quantities of product a supplier supplies in the market and quantity of product a consumer demand. The point where the supply and demand curves meet is referred to as the equilibrium price. This is the price at which a supplier agrees to supply the commodities and the consumers agree to buy.
Want to see more full solutions like this?
Chapter 5 Solutions
EBK EXPLORING MICROECONOMICS

- You are the manager of a large automobile dealership who wants to learn more about the effective- ness of various discounts offered to customers over the past 14 months. Following are the average negotiated prices for each month and the quantities sold of a basic model (adjusted for various options) over this period of time. 1. Graph this information on a scatter plot. Estimate the demand equation. What do the regression results indicate about the desirability of discounting the price? Explain. Month Price Quantity Jan. 12,500 15 Feb. 12,200 17 Mar. 11,900 16 Apr. 12,000 18 May 11,800 20 June 12,500 18 July 11,700 22 Aug. 12,100 15 Sept. 11,400 22 Oct. 11,400 25 Nov. 11,200 24 Dec. 11,000 30 Jan. 10,800 25 Feb. 10,000 28 2. What other factors besides price might be included in this equation? Do you foresee any difficulty in obtaining these additional data or incorporating them in the regression analysis?arrow_forwardsimple steps on how it should look like on excelarrow_forwardConsider options on a stock that does not pay dividends.The stock price is $100 per share, and the risk-free interest rate is 10%.Thestock moves randomly with u=1.25and d=1/u Use Excel to calculate the premium of a10-year call with a strike of $100.arrow_forward
- Please solve this, no words or explanations.arrow_forward17. Given that C=$700+0.8Y, I=$300, G=$600, what is Y if Y=C+I+G?arrow_forwardUse the Feynman technique throughout. Assume that you’re explaining the answer to someone who doesn’t know the topic at all. Write explanation in paragraphs and if you use currency use USD currency: 10. What is the mechanism or process that allows the expenditure multiplier to “work” in theKeynesian Cross Model? Explain and show both mathematically and graphically. What isthe underpinning assumption for the process to transpire?arrow_forward
- Use the Feynman technique throughout. Assume that you’reexplaining the answer to someone who doesn’t know the topic at all. Write it all in paragraphs: 2. Give an overview of the equation of exchange (EoE) as used by Classical Theory. Now,carefully explain each variable in the EoE. What is meant by the “quantity theory of money”and how is it different from or the same as the equation of exchange?arrow_forwardZbsbwhjw8272:shbwhahwh Zbsbwhjw8272:shbwhahwh Zbsbwhjw8272:shbwhahwhZbsbwhjw8272:shbwhahwhZbsbwhjw8272:shbwhahwharrow_forwardUse the Feynman technique throughout. Assume that you’re explaining the answer to someone who doesn’t know the topic at all:arrow_forward
 Economics (MindTap Course List)EconomicsISBN:9781337617383Author:Roger A. ArnoldPublisher:Cengage Learning

 Microeconomics: Private and Public Choice (MindTa...EconomicsISBN:9781305506893Author:James D. Gwartney, Richard L. Stroup, Russell S. Sobel, David A. MacphersonPublisher:Cengage Learning
 Macroeconomics: Private and Public Choice (MindTa...EconomicsISBN:9781305506756Author:James D. Gwartney, Richard L. Stroup, Russell S. Sobel, David A. MacphersonPublisher:Cengage Learning
 Economics: Private and Public Choice (MindTap Cou...EconomicsISBN:9781305506725Author:James D. Gwartney, Richard L. Stroup, Russell S. Sobel, David A. MacphersonPublisher:Cengage Learning